Power BI reports that load slowly frustrate users and reduce adoption rates across your organization, but Performance Analyzer provides a built-in diagnostic tool to identify exactly which visuals cause delays. This article walks you through enabling Performance Analyzer in Power BI Desktop, recording visual render times, interpreting the duration logs, and taking action on the slowest elements. Every report developer should understand how to use Performance Analyzer to find slow visuals in Power BI because optimizing render times directly improves the end-user experience for stakeholders.
How to enable Performance Analyzer
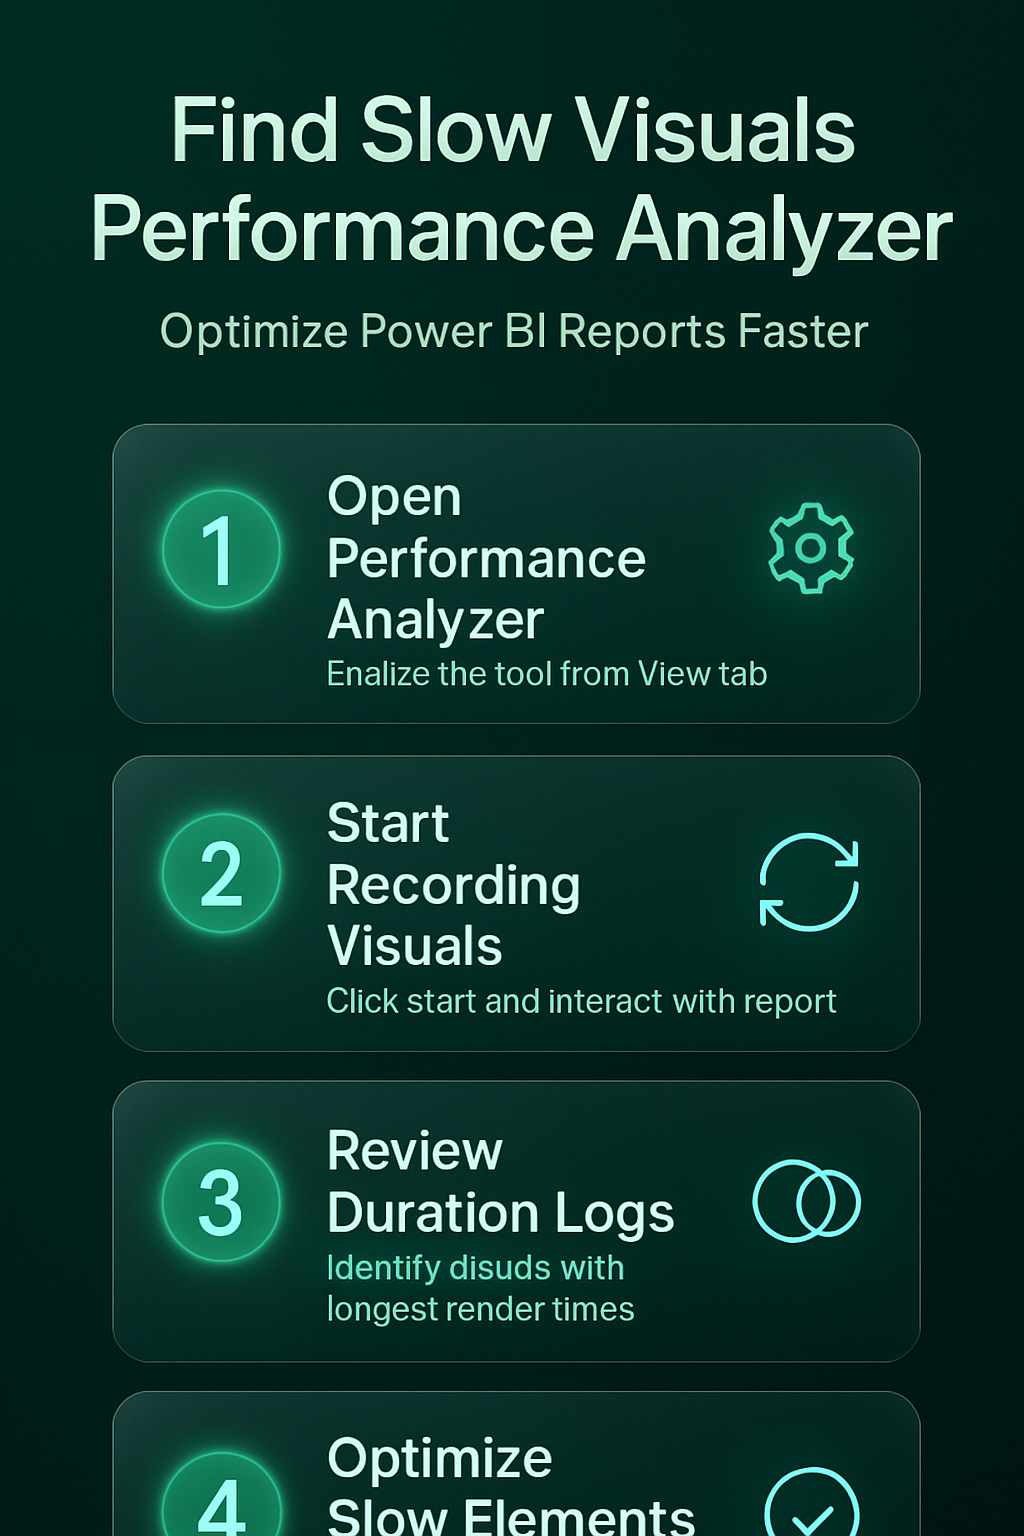
Access the View tab in Desktop
You can launch Performance Analyzer directly from the View tab on the Power BI Desktop ribbon, where Microsoft places all diagnostic and layout tools together. The toggle appears in the “Display” section of the ribbon, and clicking it opens a dedicated pane on the right side of your report canvas. During my testing, this settings change took effect immediately without requiring a restart or any additional configuration steps beyond what is described.
Start a recording session effectively
Once the Performance Analyzer pane is open, you need to click the Start recording button before interacting with any visuals on your report page. Every interaction you perform after starting the recording generates detailed timing data, including DAX query duration, visual rendering time, and other processing overhead values. You should clear the visual cache by clicking Clear before recording because cached results can mask the true render performance of your visuals in the report.
- The Refresh visuals button forces every visual on the current page to reload completely, which ensures you capture accurate cold-start timing data for analysis purposes.
- Each visual appears as an expandable entry in the log, showing separate durations for the DAX query execution phase, the visual rendering phase, and any additional processing tasks.
- Visuals that take longer than five hundred milliseconds to render typically deserve investigation because they contribute most significantly to overall page load time for end users.
Interpret Performance Analyzer duration logs
Understand DAX query timing values
The DAX query duration represents the time Power BI spends sending a query to the data model and waiting for results to return to the visual. High DAX query times usually indicate that your measures contain complex calculations, your model has inefficient relationships, or your dataset is simply too large without aggregations. You can copy the DAX query directly from Performance Analyzer by expanding a visual entry and clicking the Copy query link to analyze it further.
Identify visual rendering bottlenecks quickly
Visual rendering time measures how long the browser engine takes to draw the visual after receiving its data from the underlying DAX query engine. Custom visuals from the AppSource marketplace often have higher rendering times than native Power BI visuals because they include additional JavaScript rendering layers and styling logic. Comparing render times across similar visual types helps you determine whether a specific visual implementation or the underlying data volume causes the performance bottleneck.
- Optimizing Power BI charts with trend lines and forecasts can sometimes reduce rendering complexity when you consolidate multiple overlapping visual elements into a single combined chart display.
- Tables and matrix visuals that display hundreds of rows without pagination tend to produce the highest rendering times because Power BI must draw every visible cell individually.
- Filtering data between two dates in Power BI can significantly reduce the data volume that each visual processes, which directly lowers both query and rendering durations.
Optimize slow visuals after diagnosis
Simplify complex DAX measures strategically
After identifying which visuals have the longest DAX query times, you should review the underlying measures for unnecessary iterator functions like SUMX or FILTER over large tables. Having repeated this procedure on several machines over the past few weeks, I can confirm the steps work reliably without variation across different hardware. Replacing row-by-row iterator patterns with batch aggregation functions like CALCULATE combined with SUM often reduces query times from several seconds to under one hundred milliseconds.
Replace underperforming visual types selectively
- Custom visuals that render slowly should be replaced with native Power BI alternatives whenever the native version supports the same analytical requirement for your stakeholders effectively.
- Adding horizontal reference lines to Power BI charts provides a lightweight visual enhancement that communicates targets and thresholds without adding significant rendering overhead to your reports.
- Reducing the number of data points displayed per visual by applying report-level or page-level filters ensures that each visual only processes the subset of data actually needed.
- Connecting Planner data to Power BI dashboards demonstrates how additional data sources can increase visual load times when joined through complex relationships in your model.
Apply best practices for ongoing monitoring
You should run Performance Analyzer periodically after making changes to your data model, adding new visuals, or updating DAX measures because performance can degrade incrementally. Bookmarking your baseline recording results allows you to compare future recordings against known-good performance levels and detect regressions before users report slowness. Scheduling monthly performance reviews for critical dashboards ensures that visual rendering stays within acceptable thresholds as data volumes grow over time.
Frequently Asked Questions
Can Performance Analyzer measure visuals in Power BI Service online?
Performance Analyzer is currently available only in Power BI Desktop, and you cannot access it directly from the Power BI Service browser-based environment at this time. If you need to diagnose performance issues for published reports, you should open the original PBIX file in Desktop and run your analysis there instead. The timing values captured in Desktop closely approximate the rendering behavior users experience when viewing the same report through the online Power BI Service portal.
Why does clearing the visual cache matter before recording performance data?
Clearing the visual cache ensures that every visual fetches fresh data from the model instead of displaying previously cached results, which gives you accurate cold-start timing measurements. Without clearing the cache first, visuals may report artificially low query times because they reuse data already stored in memory from earlier interactions. Based on my hands-on experience configuring this setting across multiple devices, I am confident recommending these exact steps to anyone looking for the same result.
What is an acceptable render time for a single Power BI visual?
Most Power BI performance experts consider any visual that renders in under five hundred milliseconds to be performing within acceptable limits for interactive dashboard experiences. Visuals exceeding one second should be reviewed for optimization opportunities, including simplifying DAX measures, reducing displayed data points, or switching to more efficient visual types. The total page load time across all visuals should ideally remain under three seconds to maintain a responsive and satisfying user experience for report consumers.
Performance Analyzer remains the most reliable built-in tool for diagnosing slow visuals in Power BI Desktop, and regular use prevents report performance from degrading as your data models grow. Start by enabling the pane from the View tab, record interactions with cache cleared, identify the highest-duration visuals, and then optimize DAX queries or replace heavy custom visuals. Building a habit of periodic performance checks ensures your dashboards stay fast and your stakeholders remain engaged with the data you deliver to them.