Export Power BI Report to Excel with Formatting is possible when you export the data behind a table or matrix visual from the Power BI service and choose an Excel format that keeps the current layout. The important limitation is that Power BI exports visual data, not a pixel-perfect copy of an entire report page. Use this workflow when you need a formatted Excel workbook that keeps the table or matrix shape as closely as Power BI supports.
Before you export
Confirm that you are exporting the right thing
Power BI offers different export paths, and they do not all preserve formatting in the same way. From a dashboard tile, Power BI exports to CSV. From Power BI Desktop, report visual exports are also limited to CSV. The richer Excel choices are available from a report visual in the Power BI service.
If your goal is a workbook that looks like the visual, start from a table or matrix visual in the Power BI service. Select the visual itself, not the report page background. Then use the visual’s More options menu and choose Export data.
For a visual-level export, the EasyTweaks guide on exporting a Power BI matrix or table to Excel is the closest related workflow.
Check permissions and tenant settings
If Export data is missing or grayed out, the issue is usually permissions or governance, not Excel. Power BI admins can disable export features for the tenant, and report designers can limit whether consumers may export summarized data, underlying data, or no data. Row-level security and sensitivity labels also affect what you can export and open afterward.
Before troubleshooting the workbook, make sure to confirm that:
- You can view the data in the report.
- The report designer allows data export.
- The Fabric or Power BI admin has not disabled export to Excel.
- Your organization allows downloading protected files to the device you are using.
- You are exporting a supported visual type.
If the export is blocked, ask the report owner or Power BI admin whether export data, export to Excel, and sensitivity label policies allow the action for your user group.
Export Power BI data to Excel with current layout
Open the Power BI service report
Go to the Power BI service in your browser and open the report page that contains the table or matrix. Apply the slicers, filters, drill state, and sort order you want before exporting. Power BI exports the data as filtered by the visual.
For matrix visuals, expand or collapse levels before you export. If you need every row in the hierarchy, use the visual context menu and expand the hierarchy first.
Select Export data
Click the table or matrix visual, then open More options (…) in the visual header. Choose Export data. If you do not see the visual header, move the pointer over the upper-right area of the visual or ask the report designer whether visual header icons are hidden.
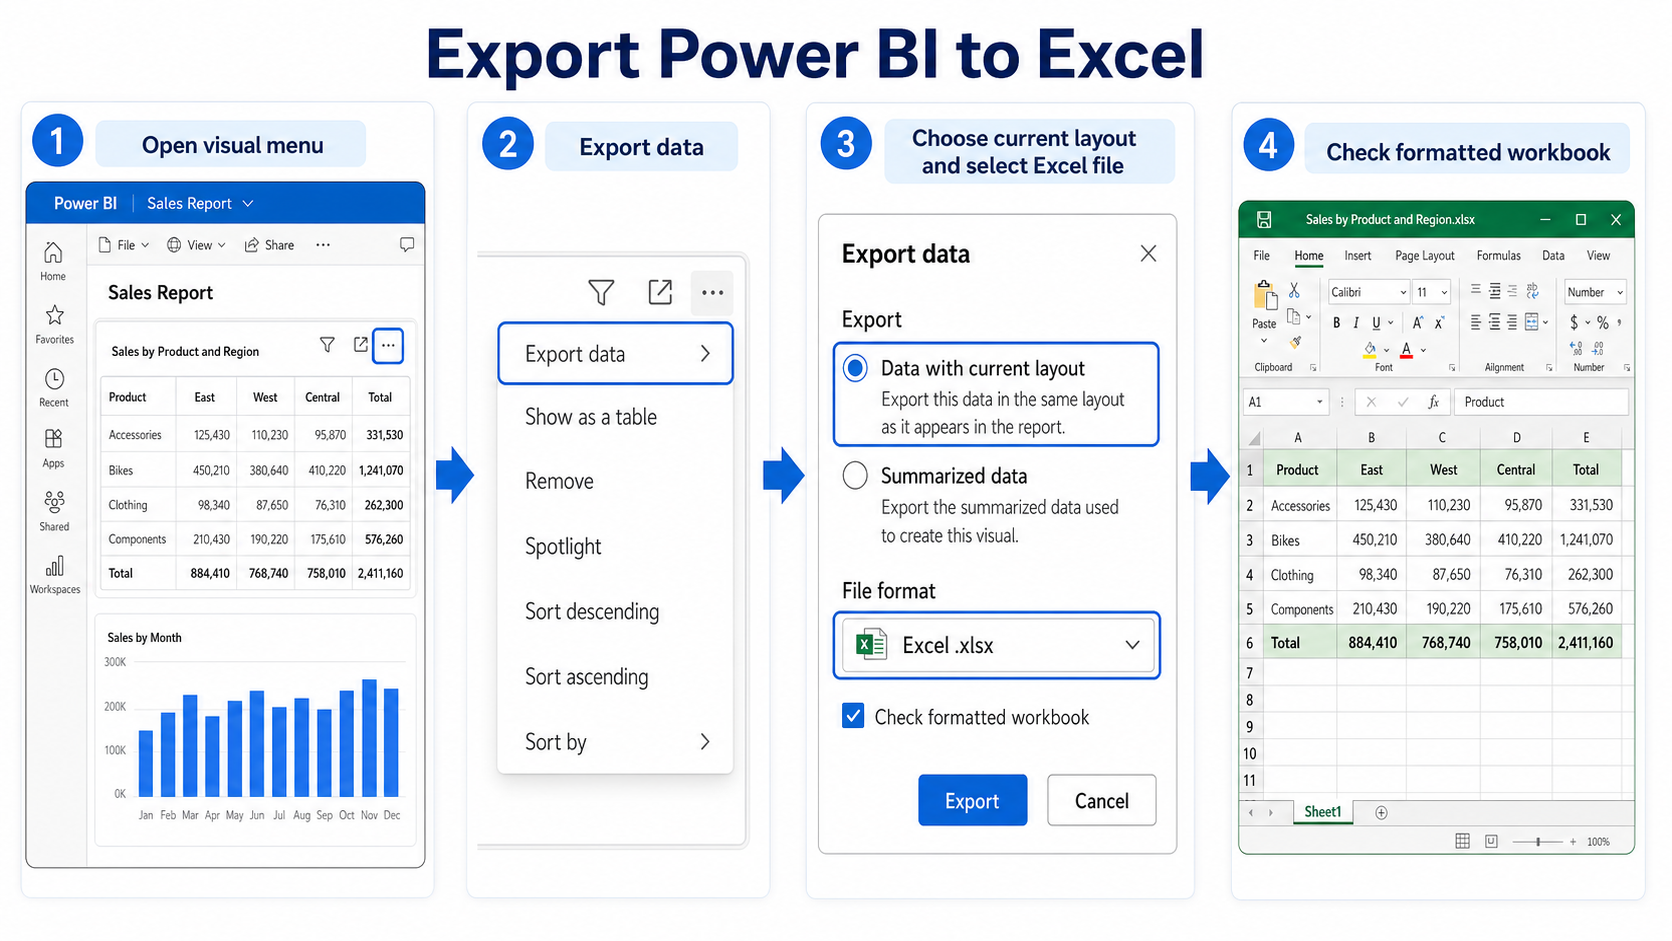
In the export dialog, choose the export type carefully:
- Data with current layout keeps the shape of the visual in Excel. This is the best choice when you want the workbook to resemble the Power BI table or matrix.
- Summarized data exports the same aggregated data but as a flatter table of rows and columns.
- Underlying data exports more detailed source rows when the model, permissions, and report settings allow it.
For the keyword in this tutorial, choose Data with current layout when it is available.
Choose Excel .xlsx
Select an Excel .xlsx file format instead of CSV. CSV is useful for raw data exchange, but it does not carry the same workbook formatting experience. Microsoft documents that exporting to an Excel file can preserve model-level and visual-level formatting, while connected tables do not preserve those same formats.
After selecting the Excel option, click Export. Your browser downloads the workbook, usually to the Downloads folder unless your browser or Teams client uses a different location. Open the workbook in Excel and review the first rows, totals, filters, and number formats before sharing it.
Keep formatting as close as possible
Use table or matrix visuals
The current-layout option is most useful with table and matrix visuals because there is a real row-and-column shape to preserve. Chart visuals can still export their summarized data, but the Excel output is a data table, not the chart design from the Power BI canvas.
For financial reports, operating dashboards, inventory reports, and monthly scorecards, build or duplicate a clean export-friendly matrix visual. Too many row groups, column groups, and measures can push the export over size or intersection limits.
If you need a more data-focused extract instead of a formatted visual, use the related EasyTweaks tutorial on extracting Excel data from Power BI to choose between visual export, Analyze in Excel, and data model options.
Understand what formatting will not survive
Power BI export is practical, but it is not a report-page converter. Dynamic formatting is not supported in the export feature, and some visual-specific formatting, such as percent of grand total for a measure, might not be preserved in Excel. Microsoft also notes that if a table or matrix uses Switch values to rows, the visual format is not preserved in Excel.
Date and time formatting can also change. Excel can display exported datetime values using your local machine’s regional date format, so validate date columns before sharing the workbook.
Add a quick QA step:
- Compare row count and totals with the Power BI visual.
- Check date columns after opening the file in Excel.
- Confirm currency and percentage formats.
- Look for a footer warning that data exceeded the allowed export volume.
- Save a reviewed copy before distributing the workbook.
Fix common export problems
Export data is missing
If Export data does not appear, try another supported visual first. Some custom visuals and configurations do not support export in the same way as native table or matrix visuals. If native visuals work but one custom visual does not, the issue is the visual type or tenant policy.
If no visuals export, the likely causes are admin settings, report settings, permissions, sensitivity labels, or row-level security. A report owner can check export settings in Power BI Desktop under File > Options and settings > Options > Current file > Report settings. A Fabric admin can review export and sharing settings in the Admin portal.
The workbook is missing rows
Power BI export limits depend on format and visual shape. Microsoft documents up to 150,000 rows for an Excel .xlsx export, while CSV has a lower 30,000-row limit. Matrix visuals using Data with current layout have a 150,000 data-intersection limit, which means cells, not just rows. A matrix with 10,000 rows and five value columns already represents 50,000 data intersections.
If the workbook is incomplete, filter the report, remove unnecessary value columns, export one business unit or date period at a time, or create a simpler table visual. With DirectQuery, exports can be smaller than expected because of a 16-MB uncompressed data limit.
Excel formatting looks different
When formatting changes, first check whether you used Data with current layout and Excel .xlsx. Then inspect the visual settings. If values are switched to rows, dynamic formatting is used, or visual-only calculations are involved, Excel may not match the report exactly.
Use Excel formatting after export for final presentation needs. Power BI is the authoritative report experience; Excel is the handoff workbook. When the audience needs a printable or presentation-style version of the entire report page, export the report to PowerPoint or PDF instead of Excel.
Power BI to Excel export questions
Can I export an entire Power BI report page to Excel?
Not as a full formatted report page. Power BI exports the data behind a visual to Excel or CSV. Use table or matrix visuals when you want a formatted workbook, and use PowerPoint or PDF export when you need a report-page snapshot.
Which option preserves formatting best?
Use Data with current layout and an Excel .xlsx file from the Power BI service. This keeps the visual’s row-and-column shape more closely than summarized data, while still exporting data rather than a screenshot.
Why is underlying data unavailable?
Underlying data can be disabled by the admin or report designer. It can also be unavailable when the data model lacks a unique key, when Show items with no data is enabled, or when permissions do not allow access to row-level source data.
For users, the reliable workflow is simple: open the report visual in the Power BI service, choose Export data, select Data with current layout, download Excel .xlsx, and verify totals before sharing the workbook.