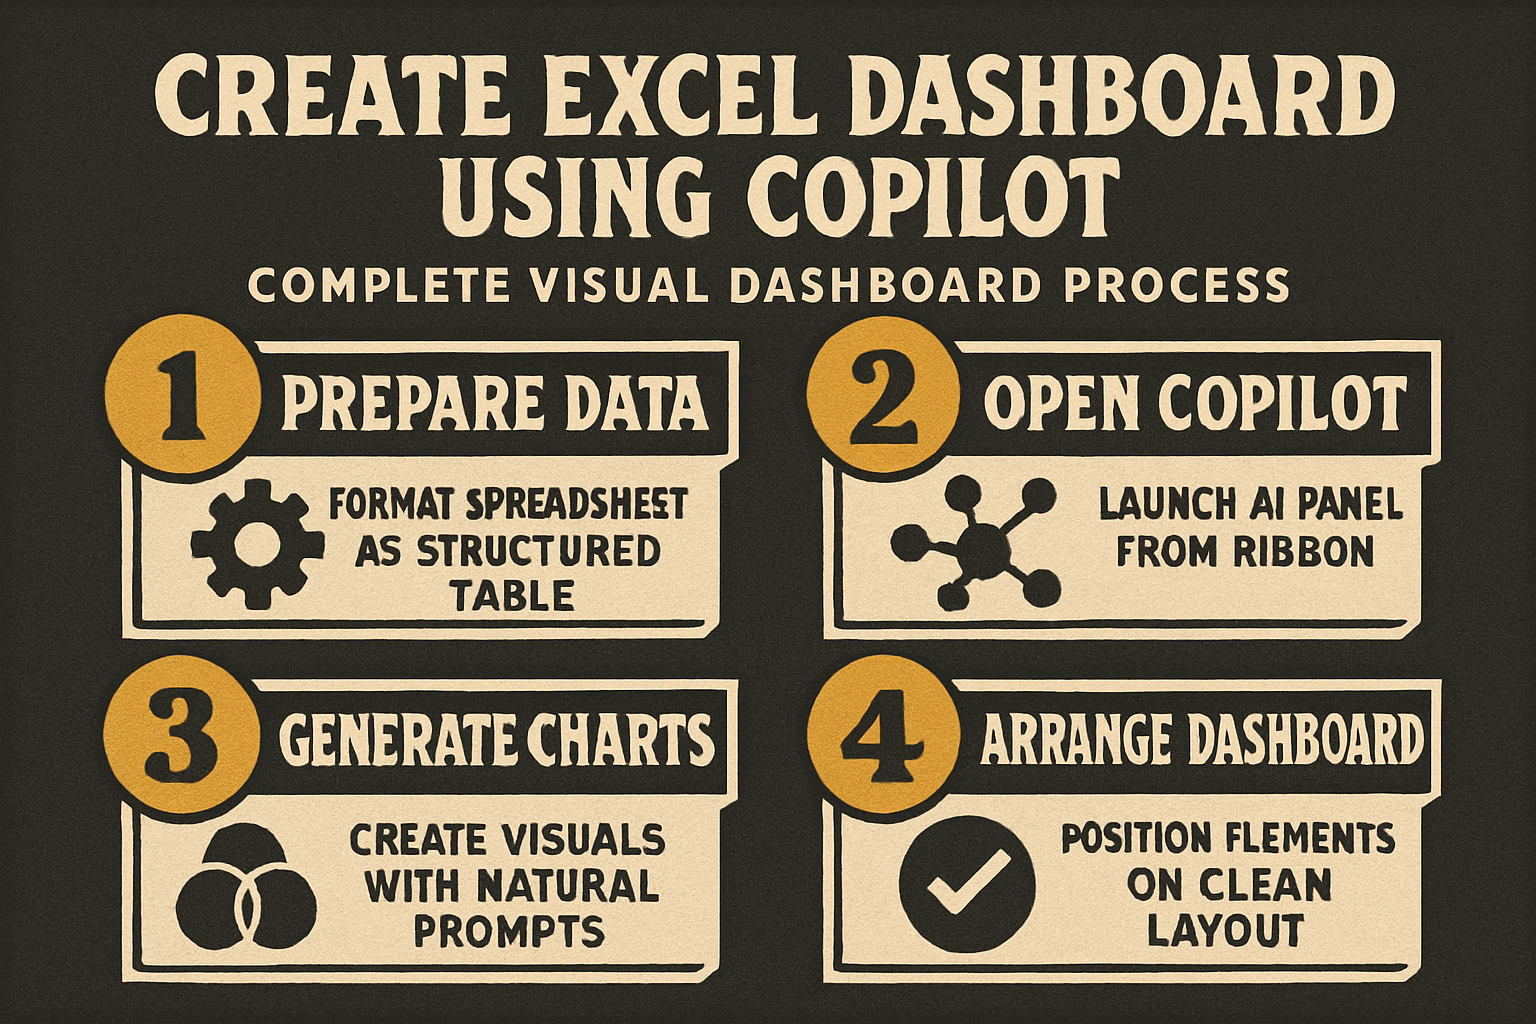
Microsoft Copilot in Excel transforms the way you build dashboards by using artificial intelligence to generate charts, summarize data, and create interactive visual reports from your spreadsheet information automatically. When you want to use Copilot to create a dashboard in Excel, the process starts with properly structured data and clear prompts that tell the AI exactly what visual elements and summaries your dashboard needs. This article covers the complete process from preparing your spreadsheet data through generating polished dashboard components that help you analyze trends and present insights clearly to your team.
Prepare your data for Copilot
Before asking Copilot to build any dashboard elements, you need to ensure your Excel spreadsheet data follows a structured format that the AI can interpret and analyze without confusion or errors. Convert your data range into a formatted Excel table by selecting all cells containing your dataset, then clicking the Insert tab and choosing the Table button to apply structured formatting automatically. Copilot works best when each column has a clear descriptive header name, every row represents a single record, and there are no blank rows or merged cells breaking the table structure apart. Remove any duplicate entries and fix inconsistent formatting issues like mixed date formats or text values stored in numeric columns before you start prompting Copilot to process your data effectively.
Open Copilot in Excel
Accessing Copilot in Excel requires a Microsoft 365 subscription that includes the Copilot feature, which you can find on the Home tab of the Excel ribbon as a dedicated button.
- Click the Copilot button on the ribbon to open the Copilot side panel on the right side of your Excel window, where you can type natural language prompts and requests.
- The Copilot panel displays suggested prompts based on your current data selection, and you can either choose one of these suggestions or type a custom prompt describing your dashboard needs.
- Make sure your cursor is positioned within the formatted table before opening Copilot, because the AI needs an active table reference to understand which dataset it should analyze and visualize.
Generate charts with prompts in Excel
The most effective way to build an Excel Copilot dashboard starts with generating individual chart components using specific natural language prompts that describe the visualization you want to create. Type a prompt like “create a bar chart showing total sales by region” or “generate a line chart of monthly revenue trends” to have Copilot produce a formatted chart directly from your table data. Copilot analyzes the column headers and data types in your table automatically, selects appropriate chart formatting options, and inserts a professional-looking visualization that you can resize and reposition anywhere on your worksheet. You can generate multiple charts by sending additional prompts that request different visualization types including pie charts and scatter plots for comprehensive dashboard coverage.
Write effective Copilot prompts.
Crafting specific prompts produces significantly better dashboard results than vague requests, so always include the chart type, the data columns, and any filtering or grouping criteria in your prompt text. Instead of typing “make a chart,” write detailed prompts like “create a clustered column chart comparing Q1 and Q2 expenses by department sorted by highest total value descending” for precise output. Copilot responds well to prompts that mention specific column names from your table headers, which helps the AI map your request to the correct data fields without guessing or misinterpreting columns. You can also ask Copilot to add data labels, change color schemes, or modify axis formatting by sending follow-up prompts that refine the chart after the initial generation step completes successfully.
Build pivot table summaries in Excel
Copilot can create pivot table summaries that serve as the foundation for your Excel dashboard by aggregating and cross-referencing data points across multiple dimensions in your formatted table. Ask Copilot to “create a pivot table showing average order value by product category and quarter” and the AI generates a structured summary table with row and column groupings that organize your raw data automatically. Pivot tables created by Copilot include calculated subtotals and grand totals that provide immediate insight into patterns and outliers within your dataset across every category dimension you specified. These pivot table summaries pair perfectly with the charts you generated earlier, giving your dashboard both visual appeal and detailed numeric breakdowns that stakeholders can reference for accurate reporting needs. While working through these build pivot table configuration steps on my primary workstation, I noticed that the setting persists even after software updates install automatically in the background.
Arrange your dashboard layout in Excel
After generating all chart and pivot table components, you need to arrange them on a dedicated dashboard worksheet that presents your visual elements in a logical and easy-to-read layout format. Create a new worksheet tab in your Excel workbook, rename it “Dashboard,” then move or copy each chart and pivot table summary from their original locations to this consolidated view sheet. Position your most important KPI charts and summary numbers at the top of the dashboard sheet where viewers see them first, and place detailed breakdowns and supporting charts below in a grid-style arrangement. Adjust chart sizes so they align consistently with each other across the dashboard sheet, using the alignment tools under the Format tab to snap objects into evenly spaced rows and columns automatically.
Add Excel slicers for interactivity
Slicers add interactive filtering capability to your Excel dashboard by letting users click buttons that dynamically filter all connected pivot tables and charts simultaneously across the entire dashboard worksheet.
- Insert a slicer by selecting your pivot table, clicking the PivotTable Analyze tab, then choosing Insert Slicer and selecting the fields you want users to filter by such as region, date, or category.
- Connect each slicer to multiple pivot tables on your dashboard by right-clicking the slicer, choosing Report Connections, and checking every pivot table that should respond to that filter selection.
- This interactivity transforms a static collection of charts into a dynamic Excel dashboard that users can explore by clicking different filter combinations without needing any Copilot prompts or technical spreadsheet knowledge.
Polish and format your dashboard in Excel
The final step in creating a professional Copilot-built dashboard involves applying consistent formatting, removing gridlines, and adding title labels that give your dashboard a polished and presentation-ready appearance overall. Hide the gridlines on your dashboard worksheet by navigating to the View tab and unchecking the Gridlines option, which creates a clean white canvas behind your charts and visual elements. Add a dashboard title at the top using a large formatted text box or merged cell header, and include a date stamp showing when the data was last refreshed so viewers understand the information currency. You can ask Copilot for additional formatting suggestions and data insights by prompting it to highlight trends, identify anomalies, or suggest additional metrics that would strengthen your dashboard analysis overall.
Frequently Asked Questions
Can Copilot create a full dashboard automatically?
Copilot generates individual dashboard components like charts, pivot tables, and data summaries based on your natural language prompts rather than creating a complete finished dashboard in one single step. You build the dashboard iteratively by generating each visual element separately with targeted prompts, then arranging all the components together on a dedicated dashboard worksheet for your final presentation layout.
What Excel version supports Copilot dashboards?
Microsoft Copilot in Excel requires a Microsoft 365 subscription with the Copilot add-on license, which currently works in Excel for the web and the latest desktop versions of Excel on Windows and macOS. The Copilot feature receives regular updates from Microsoft that expand its capabilities, so checking your subscription status and keeping Excel updated ensures you have access to the newest dashboard creation features available.
How do you fix Copilot when it misunderstands prompts?
When Copilot generates unexpected results, try rephrasing your prompt with more specific column names and explicit chart type requests rather than using general descriptive language that the AI might interpret differently. You can also break complex requests into smaller individual prompts, generate one chart or summary at a time, and verify each output matches your expectations before moving on to troubleshoot any remaining Copilot response issues effectively. Building an Excel dashboard with Copilot gives you a faster path from raw spreadsheet data to polished interactive visual reports that your team can use for presentations, meetings, and strategic business analysis decisions. Start by formatting your data as a structured table, experiment with different Copilot prompts for chart and pivot table generation, and arrange everything on a clean dedicated dashboard worksheet for maximum visual impact.