You’re working late again, manually updating pivot tables and creating charts for your monthly sales report. The data keeps changing, formulas break, and you find yourself recreating the same visualizations every month. This repetitive process consumes valuable time that could be better spent analyzing trends and making strategic decisions. Microsoft Copilot in Excel offers a solution by automating these routine reporting tasks through intelligent AI assistance that understands your data patterns and generates insights automatically.
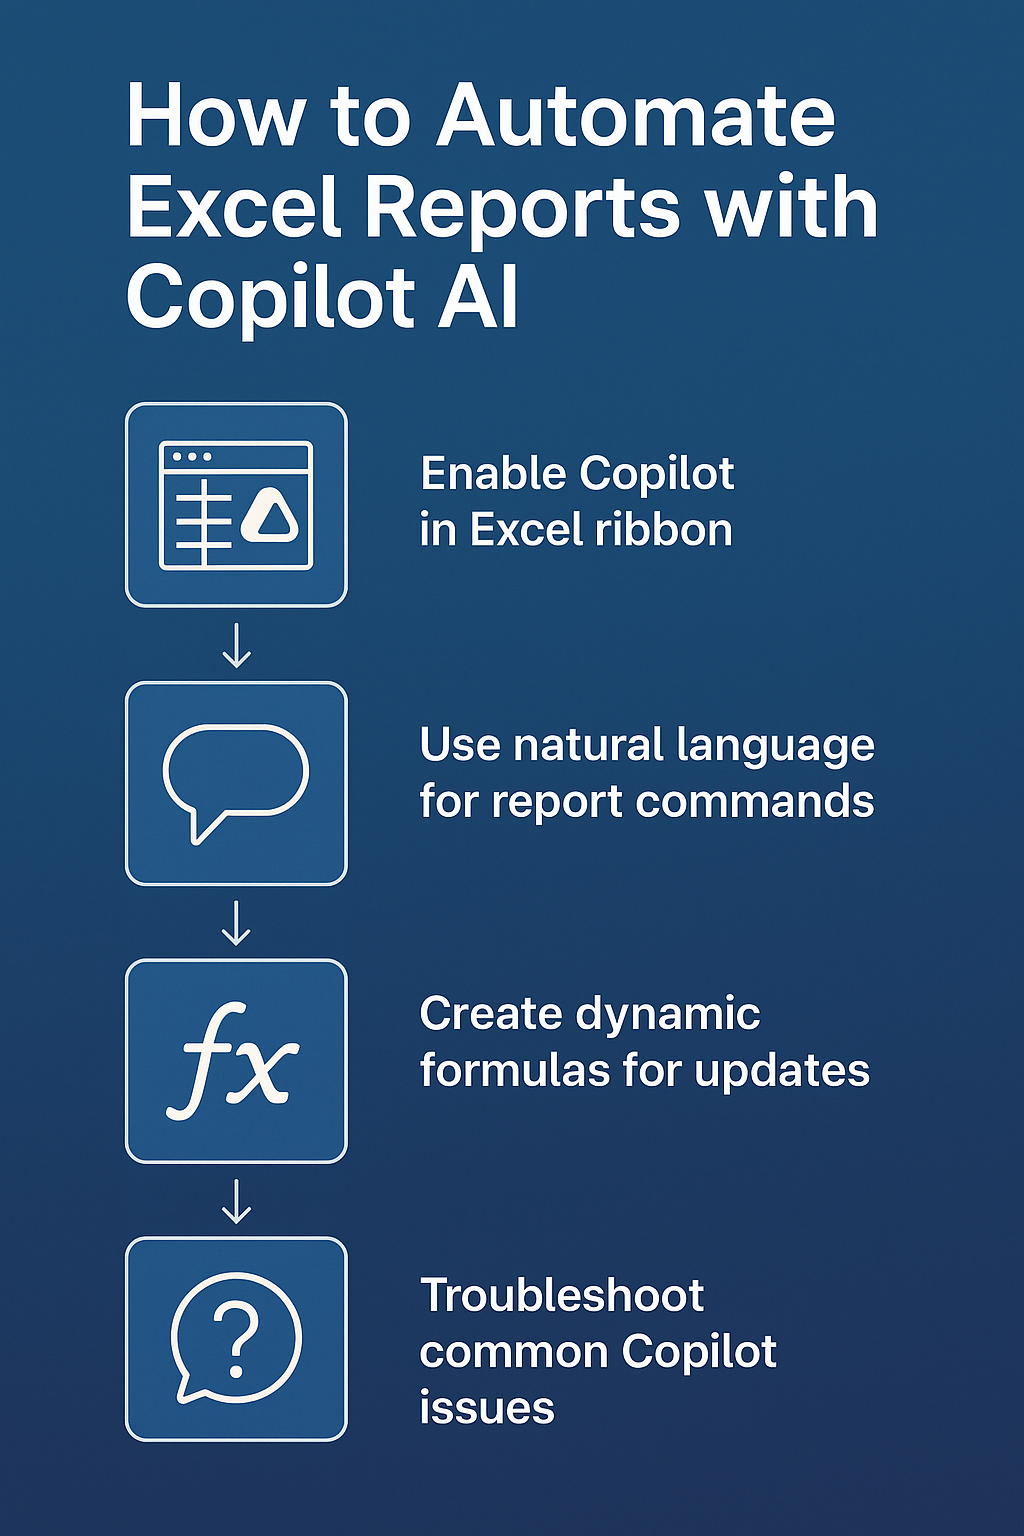
Enable automated reporting workflows in M365 Copilot
Manual report creation represents a significant productivity bottleneck for most Excel users, particularly when dealing with large datasets and recurring monthly or quarterly deliverables. The traditional approach requires extensive formula knowledge, pivot table expertise, and considerable time investment to ensure accuracy and consistency.
This tutorial demonstrates how to enable Copilot in Excel and leverage its AI capabilities to automate report generation, from data analysis to chart creation. You’ll learn to configure Excel Copilot function 2025 features that transform raw data into professional reports with minimal manual intervention. Learn more about formula generator to enhance automation.
Microsoft Copilot in Excel sheet activation and configuration
Begin the setup process by launching Excel and opening a workbook containing your source data, ensuring your data includes headers and follows a consistent structure throughout all columns. Navigate to the ribbon interface and locate the Copilot button, typically positioned in the Home tab alongside other productivity tools.
- Click the Copilot icon to open the AI assistant panel on the right side of your Excel interface, which displays welcome prompts and suggests initial actions based on your current worksheet content.
- Verify your Microsoft 365 subscription includes Copilot access by checking the Account settings under File menu, where active services and license information appear in the subscription details section.
- Configure data region selection by highlighting your entire dataset, including headers, which allows Copilot to understand the scope and structure of information available for analysis and automation tasks.
- Enable automatic data type detection by selecting your data range and choosing Data > Data Types from the ribbon, which helps Copilot understand whether columns contain dates, currencies, or categorical information for better processing.
**Expert Tip**: Ensure your data contains no blank rows or columns within the dataset boundaries, as gaps can confuse Copilot’s data interpretation algorithms and lead to incomplete or inaccurate automated reports.
Excel Copilot AI report generation commands
Access the natural language interface by typing specific prompts into the Copilot chat panel, using clear and descriptive language to communicate your reporting requirements and desired output format preferences.
- Type “Create a monthly sales summary showing total revenue by product category and sales representative” to generate comprehensive pivot table reports that automatically organize your data into meaningful business insights.
- Request chart generation by entering “Generate a bar chart showing top 5 performing products this quarter” which produces professional visualizations complete with appropriate scaling, colors, and formatting for presentation purposes.
- Use formula assistance commands like “Calculate year-over-year growth percentage for each product line” to generate complex calculations that would typically require advanced Excel knowledge and multiple formula combinations.
Explore advanced data entry automation with Copilot for efficient inputs.
- Implement conditional formatting requests such as “Highlight cells where sales exceeded target by more than 20%” to create visual data indicators that immediately draw attention to exceptional performance metrics.
Copilot in Excel formula automation for recurring reports
Establish reusable formula patterns by prompting Copilot to create dynamic calculations that automatically adjust when new data gets added to your worksheet, eliminating the need for manual formula updates each reporting period.
- Generate dynamic date ranges using prompts like “Create formulas that automatically calculate current month and previous month totals” which produces EOMONTH and TODAY functions that adjust automatically with each report refresh cycle.
- Build automated ranking systems by requesting “Rank all sales representatives by total revenue and show their percentile performance” which creates sophisticated RANK and PERCENTILE functions that update dynamically as new data arrives.
- Implement variance analysis through commands such as “Calculate percentage difference between actual and budgeted amounts for each department” resulting in robust comparison formulas that highlight performance gaps and achievements.
- Create conditional summary calculations using natural language like “Sum all sales where region equals North and product type contains Electronics” which generates complex SUMIFS formulas with multiple criteria for precise data aggregation.
Excel Copilot function practical implementation
Here are a few automation use cases / ideas for creating Excel based reports:
- Design executive summary sections by prompting “Create a summary table showing key performance indicators including total sales, average deal size, and conversion rates” which generates professional formatting with calculated metrics prominently displayed.
- Establish trend analysis capabilities through requests like “Add sparklines showing 12-month sales trends for each product category” resulting in compact visualizations that reveal patterns and seasonality within your data structure.
- Build exception reporting features using commands such as “Identify all transactions exceeding $10,000 and flag potential data entry errors” which creates validation rules and conditional highlighting for quality control purposes.
- Implement automated formatting requests like “Apply professional table formatting with alternating row colors and bold headers” to ensure consistent presentation standards across all generated report elements.
**Remember**: Save your Copilot-enhanced workbook as a template file to preserve all automated formulas and formatting, enabling rapid report generation for future periods with minimal setup requirements.
Challenges when implementing Excel Copilot function
Users frequently encounter specific obstacles when enabling and utilizing Copilot functionality, particularly regarding data formatting requirements and license verification processes that can prevent successful AI integration with existing workflows.
- Copilot button appears grayed out or missing from the ribbon interface, typically indicating insufficient Microsoft 365 licensing or outdated Excel application versions that require immediate updating to support AI features properly.
- Data recognition errors occur when Copilot cannot properly interpret column headers or data types, usually resolved by ensuring consistent formatting throughout the dataset and removing special characters from header names that confuse parsing algorithms.
- Formula generation produces incorrect results or errors when source data contains merged cells, blank rows, or inconsistent data types, requiring cleanup of the dataset structure before Copilot can generate accurate automated calculations successfully. Learn more troubleshooting data cleaning tools.
- Limited response quality happens when prompts lack specificity or context, improved by providing detailed descriptions of desired outcomes and referencing specific column names and data ranges in your natural language requests to Copilot.