How to use Copilot in Excel for trend discovery?
“How can I quickly identify patterns and trends in my quarterly sales data without spending hours creating complex formulas and charts?” This question reflects a common challenge faced by analysts, managers, and business professionals who need to extract meaningful insights from large datasets efficiently. Excel Copilot transforms this traditionally time-consuming process into an intuitive, AI-powered experience that democratizes advanced data analysis capabilities.
Understanding Excel Copilot capabilities for trend analysis
Modern businesses generate vast amounts of data that require sophisticated analysis to uncover actionable trends and patterns. Traditional Excel analysis often demands extensive formula knowledge, pivot table expertise, and manual chart creation that can take hours to complete properly.
This tutorial demonstrates how to leverage Excel Copilot’s artificial intelligence to analyze trends in business data through natural language commands and automated insights generation. You will learn to transform raw data into compelling visualizations, identify significant patterns, and generate professional reports using conversational AI interactions.
The workflow covers importing data, configuring Copilot for trend analysis, generating automated insights, creating dynamic visualizations, and exporting results for stakeholder presentations. Prerequisites include an active Microsoft 365 subscription with Copilot access, basic Excel familiarity, and sample dataset containing time-series information such as sales figures, performance metrics, or financial data.
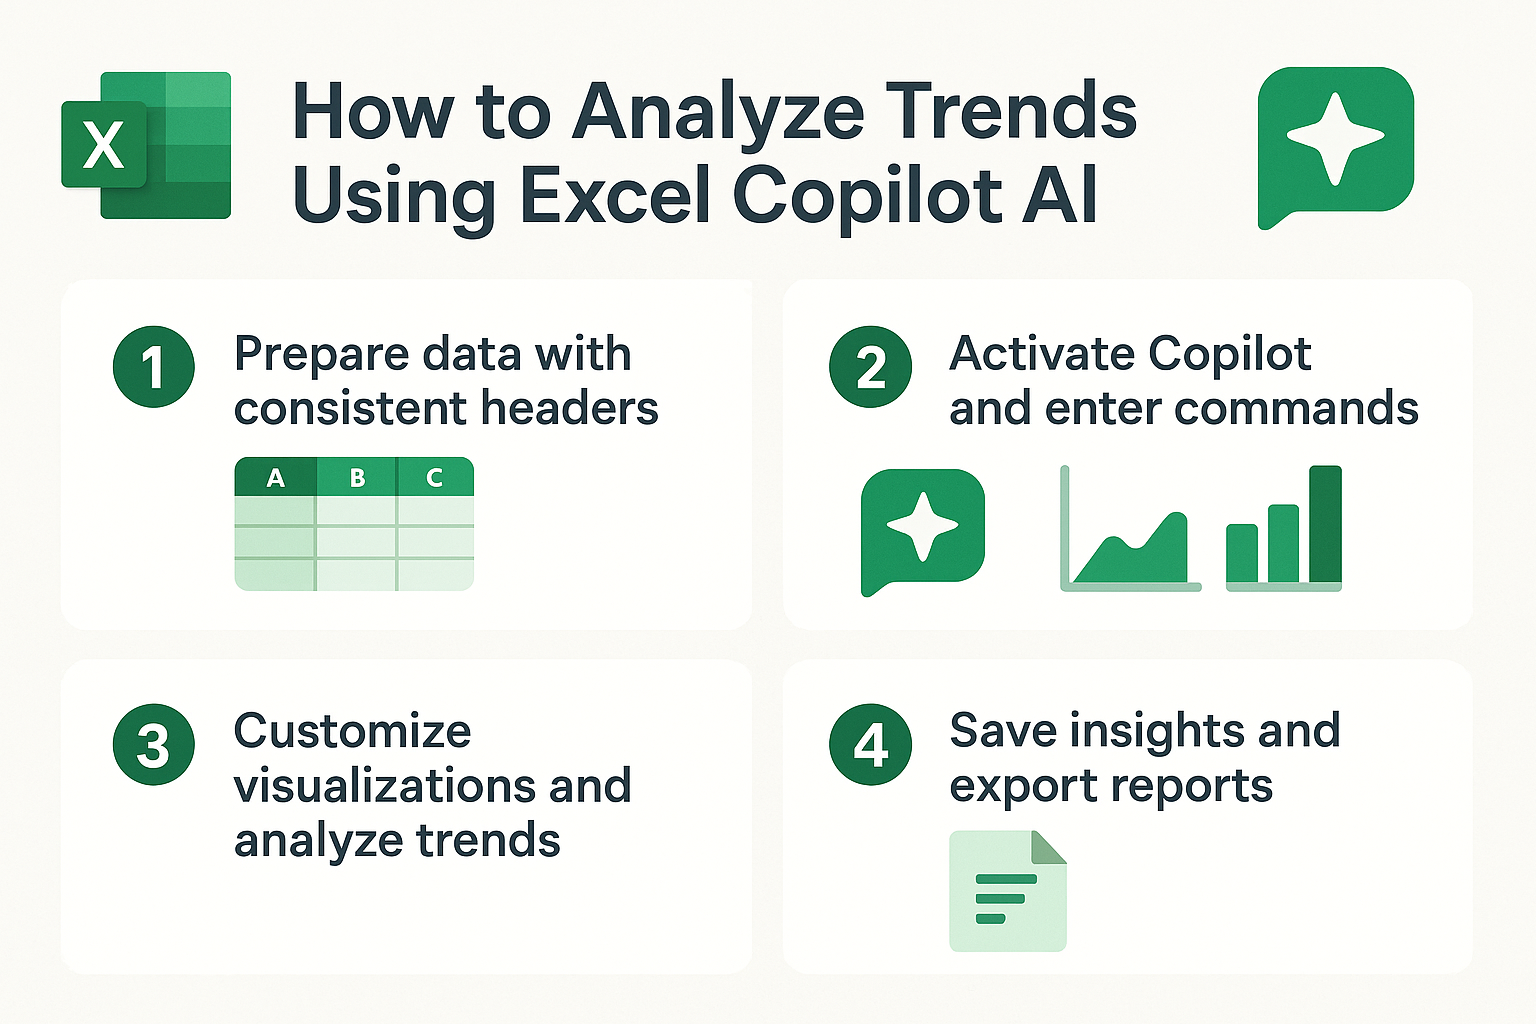
How to use Copilot for automated trend identification
Expert Tip: Always ensure your data includes consistent date formatting and clear column headers before initiating Copilot analysis to maximize accuracy and insight quality.
- Open Excel and navigate to the worksheet containing your time-series data, ensuring columns include dates, numerical values, and descriptive categories that will enable comprehensive trend analysis across multiple dimensions and timeframes.
- Click the Copilot icon in the ribbon or press Alt + H to activate the AI assistant, which will appear as a chat panel on the right side of your screen ready to receive natural language commands for data analysis tasks.
- Type your initial analysis request such as “Analyze trends in my sales data over the past 12 months” to provide Copilot with clear context about the type of analysis you need and the specific timeframe for investigation.
- Review the automatic data range selection that Copilot suggests, and confirm or adjust the range to ensure it includes all relevant data points, headers, and time periods necessary for comprehensive trend analysis and pattern recognition.
- Allow Copilot to process the data and generate initial insights, which typically include identification of upward trends, downward movements, seasonal patterns, and statistical summaries that highlight the most significant changes in your dataset.
Advanced trend analysis techniques with Excel Copilot
- Request specific trend visualizations by asking “Create a line chart showing monthly revenue trends with a trendline” to generate professional charts that clearly illustrate data patterns and make trends immediately visible to stakeholders and decision makers.
- Use follow-up prompts like “Identify the top three months with highest growth rates” to drill down into specific periods of interest and understand which timeframes contributed most significantly to overall performance metrics and business outcomes.
- Ask Copilot to “Compare current quarter performance against the same period last year” to establish year-over-year comparisons that provide context for current trends and help distinguish between seasonal variations and genuine performance changes.
- Generate correlation analysis by requesting “Show me how marketing spend correlates with sales trends” to uncover relationships between different variables and identify potential cause-and-effect patterns that inform strategic business decisions.
- Request seasonal decomposition analysis with prompts like “Break down my data to show seasonal patterns, trends, and irregular components” to gain deeper understanding of underlying data structures and cyclical behaviors affecting your business metrics.
Creating comprehensive trend reports using Copilot assistance
- Ask Copilot to “Summarize the key trends and provide actionable insights” to generate executive summaries that translate complex data patterns into clear business recommendations suitable for leadership presentations and strategic planning sessions.
- Request automated forecasting with commands like “Project next quarter trends based on current data patterns” to leverage Excel’s built-in forecasting capabilities enhanced by Copilot’s intelligent analysis and pattern recognition algorithms.
- Generate comparative analysis by asking “Compare performance trends across different product categories” to identify which business segments are performing well and which areas may require additional attention or strategic intervention from management teams.
- Create dashboard elements by requesting “Build a summary table showing key trend metrics and percentage changes” to consolidate the most important findings into easily digestible formats that stakeholders can quickly understand and act upon.
Important Tip: Save your Copilot conversation history by copying key insights into separate worksheet cells, as chat sessions may not persist between Excel sessions.
Troubleshooting Excel Copilot trend analysis challenges
- Copilot fails to recognize data patterns or provides generic responses instead of specific trend insights about your dataset. This typically occurs when data formatting is inconsistent, contains merged cells, or lacks proper headers that help the AI understand data structure and relationships effectively.
- Generated charts and visualizations do not accurately represent the intended trend analysis or display incorrect data ranges. Verify that your selected data range includes all necessary columns and rows, remove any blank rows or columns within the dataset, and ensure date formatting follows consistent patterns throughout the entire range.
- Copilot provides limited insights or suggests that more data is needed for meaningful trend analysis. This happens with small datasets or insufficient time periods, so consider expanding your data range to include more historical information or combining multiple related datasets to provide richer context for analysis.
- Natural language commands are not interpreted correctly, resulting in unexpected analysis results or error messages from the AI assistant. Refine your prompts to be more specific about the type of analysis desired, use clear business terminology instead of technical jargon, and break complex requests into smaller, more focused questions that Copilot can process effectively.