Understanding Windows 11 system monitoring challenges
“My Windows 11 computer has been running slowly, and I’ve noticed some applications crashing unexpectedly. How can I investigate what’s causing these issues and monitor my system’s health more effectively?” This question reflects a common challenge faced by IT administrators and power users who need to diagnose system problems and maintain optimal computer performance.
System log analysis and monitoring solution overview
Windows 11 includes Event Viewer, a powerful built-in tool that records detailed information about system operations, application behavior, and security events. Understanding how to navigate and interpret these logs enables you to identify root causes of system issues, monitor security events, and maintain proactive system health management.
Today we will learn to use the Event Viewer in Windows 11, navigate its interface, filter and search through event logs, and interpret common event types for effective system diagnostics. You will learn to locate specific error messages, understand event severity levels, and export log data for further analysis.
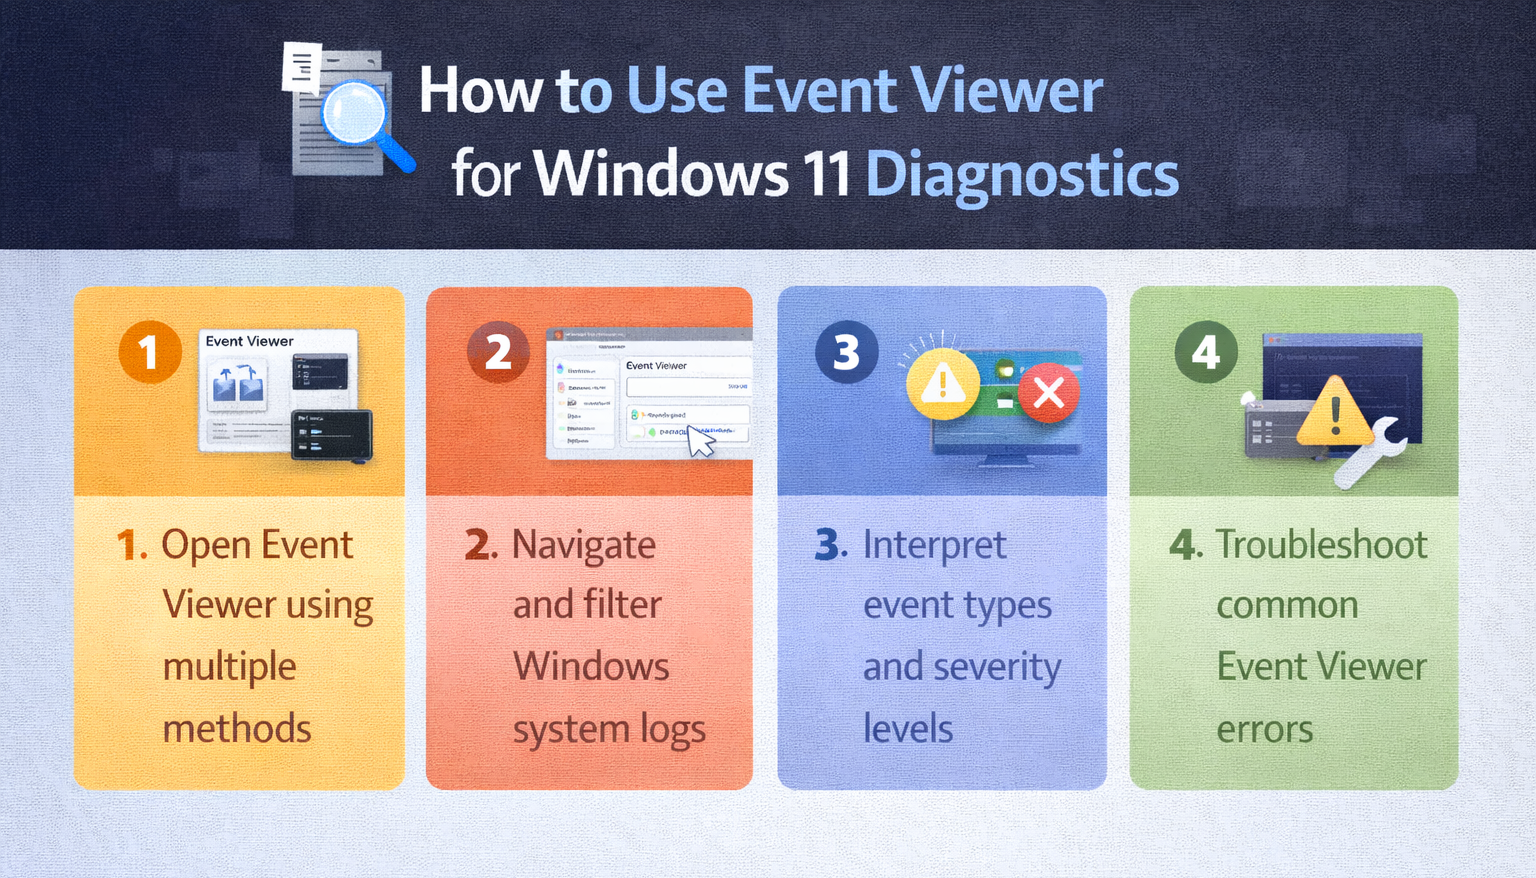
Accessing Event Viewer through multiple methods
Event Viewer can be opened through several convenient methods in Windows 11, providing flexibility for different user preferences and workflow scenarios.
- Press the Windows key and type “Event Viewer” in the search box, then click on the Event Viewer app that appears in the search results to launch the application immediately.
- Right-click on the Start button to open the Power User menu, select “Computer Management” from the list, and then expand “System Tools” in the left pane to locate and click on “Event Viewer” for direct access.
- Use the Run dialog by pressing Windows key + R, type “eventvwr.msc” in the text field, and press Enter to launch Event Viewer directly through the Microsoft Management Console interface.
- Access Event Viewer through Control Panel by navigating to “System and Security,” clicking on “Administrative Tools,” and then double-clicking on “Event Viewer” from the available system utilities.
Understanding the Event Viewer interface layout
The Event Viewer interface consists of three primary panes that organize system information in a logical hierarchy for efficient navigation and analysis.
- The left pane displays the console tree containing different log categories including “Windows Logs,” “Applications and Services Logs,” and “Subscriptions” which organize events by their source and type.
- The middle pane shows a detailed list of events within the selected log category, displaying columns for Level, Date and Time, Source, Event ID, and Task Category for comprehensive event information.
- The right pane contains the Actions panel with available operations for the selected item, including options to filter current log, find specific events, save logs, and clear log contents as needed.
- The bottom section provides detailed information about the selected event, including the General tab with event description and the Details tab with technical XML data for advanced troubleshooting scenarios.
Navigating Windows logs for system diagnostics
Windows Logs contain the most commonly accessed system information and represent the primary location for troubleshooting most Windows 11 issues and monitoring system health.
- Click on “Windows Logs” in the left pane to expand the category and reveal subcategories including Application, Security, Setup, System, and Forwarded Events for comprehensive system monitoring coverage.
- Select “System” logs to view events related to Windows components, device drivers, and system services, which typically contain information about startup issues, hardware problems, and system configuration changes.
- Access “Application” logs to examine events generated by installed programs and Windows applications, helping identify software conflicts, application crashes, and compatibility issues affecting system performance.
- Review “Security” logs to monitor authentication events, logon attempts, privilege changes, and security policy modifications, providing essential information for security auditing and compliance requirements.
Expert Tip: System and Application logs contain the most relevant information for general troubleshooting, while Security logs require administrative privileges to view detailed authentication and access control events.
Filtering and searching event information
Event Viewer provides robust filtering and searching capabilities to help you locate specific events quickly without manually scrolling through thousands of log entries.
- Right-click on any log category and select “Filter Current Log” to open the filter dialog, where you can specify criteria such as event level, time range, event sources, and keywords.
- Use the “Event level” checkboxes to focus on specific severity levels including Critical, Error, Warning, Information, and Verbose events based on your diagnostic needs and troubleshooting priorities.
- Enter specific Event IDs in the “Event ID” field if you know the particular error code you want to investigate, or include multiple IDs separated by commas for comprehensive searches.
- Specify date and time ranges using the “Logged” dropdown to narrow results to recent events or specific time periods when problems occurred, improving search efficiency and relevance.
- Apply keyword filters in the “All Event IDs” section by entering terms related to applications, services, or error messages you want to locate within the event descriptions and details.
Interpreting common event types and severity levels
Understanding event severity levels and common event patterns helps you prioritize issues and determine appropriate response actions for maintaining system stability and performance.
- Critical events indicate system failures or serious errors that require immediate attention, such as system crashes, boot failures, or critical service stops that impact system functionality significantly.
- Error events represent problems that may not stop system operation but indicate issues requiring investigation, including application failures, driver problems, or service startup failures affecting specific functions.
- Warning events highlight potential problems or unusual conditions that may lead to future issues, such as low disk space, network connectivity problems, or deprecated feature usage notifications.
- Information events provide routine operational details about successful operations, service starts, configuration changes, and normal system activities that help establish baseline system behavior patterns.
- Verbose events offer detailed diagnostic information primarily useful for developers and advanced troubleshooting scenarios, providing extensive technical details about system operations and internal processes.
Analyzing event details for troubleshooting
Each event entry contains comprehensive information that helps identify root causes and develop appropriate solutions for system issues and performance problems.
- Double-click any event to open the Event Properties dialog, which displays the General tab with human-readable event description, source information, and relevant system context for initial analysis.
- Review the Event ID number and Source information to research specific error codes online or in Microsoft documentation, as these identifiers provide precise problem identification and solution guidance.
- Examine the Details tab to access raw XML data containing technical parameters, error codes, and system state information useful for advanced troubleshooting and vendor support interactions.
- Note the User and Computer fields to determine whether issues affect specific user accounts or occur system-wide, helping narrow troubleshooting scope and identify potential security or configuration problems.
- Copy event details using the “Copy” button in the Actions pane to share information with support teams, document issues for future reference, or research solutions online effectively.
Troubleshooting Event Viewer access and functionality issues
Several common challenges may prevent proper Event Viewer access or limit its functionality, but these issues can be resolved through systematic troubleshooting approaches.
- If Event Viewer fails to open or displays “Access Denied” errors, right-click on the Event Viewer shortcut and select “Run as administrator” to ensure sufficient privileges for accessing system logs and security information. See how to fix file access denied issues.
- When specific log categories appear empty or show “The handle is invalid” errors, restart the Windows Event Log service by opening Services.msc, locating “Windows Event Log,” and clicking “Restart” to refresh log access connections.
- If events are not displaying recent information or seem outdated, refresh the log view by pressing F5 or right-clicking the log category and selecting “Refresh” to update the display with current event data.
- When Event Viewer responds slowly or becomes unresponsive, clear unnecessary log files by right-clicking on log categories, selecting “Clear Log,” and choosing whether to save events before clearing to improve performance and responsiveness. Learn tips to improve Windows 11 performance issues.