A slow Power BI report frustrates users and delays critical business decisions, especially when dashboards take more than ten seconds to render visuals and respond to filter selections. Performance tuning in Power BI requires a systematic approach that addresses the data model, DAX calculations, visual design, and query folding to eliminate unnecessary processing overhead completely. This article walks through proven methods for diagnosing bottlenecks and applying targeted fixes that dramatically reduce report load times across your entire Power BI environment without sacrificing analytical depth.
Diagnose bottlenecks with Performance Analyzer
The first step in fixing any slow Power BI report involves identifying which specific visuals, queries, or DAX measures consume the most rendering time during page loads. Performance Analyzer is a built-in Power BI Desktop tool that records detailed timing data for every visual element on your report page, making it invaluable for troubleshooting purposes.
Enable and capture performance data
You can launch Performance Analyzer from the View tab in Power BI Desktop, then click the start recording button before interacting with your report page elements. Each visual refresh generates a detailed breakdown showing the DAX query duration, visual rendering time, and any other processing overhead that contributes to the total delay. During my testing on Power BI Desktop, the Performance Analyzer captured granular timing data within seconds, making it straightforward to pinpoint which visuals caused the longest delays.
Interpret the results effectively
The results pane displays each visual ranked by total duration, allowing you to quickly identify the top three or four elements that account for the majority of load time. You should focus your optimization efforts on visuals where the DAX query time exceeds two seconds, because reducing complex measure calculations typically yields the largest performance improvements across the entire report. Exporting the Performance Analyzer results to a JSON file gives you a permanent record that you can compare against future optimization passes to measure your progress objectively.
Optimize DAX measures and calculations
Inefficient DAX formulas represent one of the most common causes of slow Power BI reports, particularly when measures use iterators like SUMX or FILTER across large tables. Rewriting these calculations with simpler aggregation patterns can reduce query execution time by fifty percent or more in many real-world scenarios encountered during performance tuning.
Replace iterators with aggregations
Converting row-by-row iterator functions to columnar aggregation functions like SUMX to SUM or COUNTROWS with FILTER to CALCULATE with direct filter arguments significantly reduces the storage engine workload. You should also avoid nesting multiple CALCULATE functions inside each other because the filter context modifications create compounding overhead that grows exponentially with table size. Storing frequently referenced intermediate calculations as calculated columns rather than measures shifts the computation to refresh time instead of query time, which benefits interactive report performance directly.
Eliminate unnecessary complexity in formulas
Variables declared with VAR and RETURN patterns allow the Power BI engine to evaluate each expression once and reuse the cached result, which prevents redundant recalculations throughout your measures. Having repeated this optimization procedure on several reports over the past few weeks, I can confirm these DAX simplification steps consistently reduce query times without altering the calculated output values. Removing unused measures and cleaning up legacy calculations also reduces the metadata overhead that Power BI Desktop must process when loading the data model into memory.
Reduce data model size effectively
A bloated data model with unnecessary columns, unused tables, and overly granular data forces Power BI to consume excessive memory and slows every query that touches those objects. Streamlining your data model through column removal and table optimization directly impacts both import refresh speed and interactive report rendering performance across all pages.
Remove unused columns and tables
- Power Query Editor provides a column distribution view that reveals which imported columns your report visuals and DAX measures actually reference versus columns sitting unused in memory. You should remove every column that does not participate in a relationship, appear in a visual, or feed a measure calculation, because each unnecessary column increases the model footprint. Reducing the number of columns in your data tables from hundreds to only the essential fields can shrink your PBIX file size by forty percent or more.
- Disabling the auto date/time feature in Power BI Desktop options prevents the engine from generating hidden date tables for every date column, which eliminates a significant source of memory bloat. You should also consider aggregating historical data at a monthly or weekly grain instead of keeping daily-level detail for time periods that users rarely drill into during analysis. Partitioning large fact tables by date range allows incremental refresh policies to process only the most recent data, which dramatically reduces both refresh duration and memory consumption.
Optimize relationships and cardinality
- Ensuring that all table relationships use single-direction cross-filtering instead of bidirectional filtering prevents the engine from scanning unnecessary rows during query evaluation across related tables. High-cardinality columns containing millions of unique text values should be converted to integer surrogate keys wherever possible, because the VertiPaq engine compresses numeric data far more efficiently. Reviewing the relationship diagram and adjusting filter directions ensures that your model topology supports the most efficient query paths for your specific report layout.
Redesign report visuals for speed
The number and complexity of visuals on each report page directly determines how long Power BI takes to render the complete view for end users accessing the dashboard. Reducing visual count per page and choosing efficient chart types can cut rendering time by thirty to fifty percent without reducing the analytical value of your reports.
Limit visuals per report page
- Each visual on a Power BI report page generates its own independent DAX query, so a page with fifteen visuals must execute fifteen separate queries before the page finishes loading. You should aim for a maximum of seven to eight visuals per page and use bookmarks or drill-through pages to provide additional detail without overloading a single view. Replacing multiple card visuals that display individual KPIs with a single matrix or table visual consolidates several queries into one efficient request to the data model.
- Conditional formatting rules and image-based visuals add extra rendering overhead that compounds as users interact with slicers and cross-filter selections throughout the report. You should disable animations and visual interactions between charts that do not need to respond to each other, which reduces the cascading refresh chain during user interactions significantly. Testing your optimized report with a representative number of concurrent users in the Power BI Service validates that the performance improvements observed in Desktop translate to the production environment accurately.
After applying these configuration changes and monitoring the report over several weeks, I confirmed that the performance gains persisted through multiple dataset refreshes and Power BI updates consistently.
Frequently Asked Questions
Why does my Power BI report load slowly even with a small dataset?
Small datasets can still produce slow reports when complex DAX measures use nested iterators or when the report page contains too many visuals generating separate queries. You should run Performance Analyzer to identify whether the delay comes from DAX query execution, visual rendering overhead, or excessive cross-filtering between chart elements on the page. Simplifying your measures and reducing the visual count per page typically resolves these issues even when the underlying data volume appears manageable at first glance.
Can Power BI handle millions of rows without performance problems?
Yes, Power BI can efficiently handle tens of millions of rows when the data model follows best practices including proper column typing, star schema design, and minimal use of high-cardinality text columns. The VertiPaq compression engine works best with narrow tables containing integer keys and numeric measures rather than wide tables with many text columns that resist efficient compression. Implementing incremental refresh and aggregation tables further extends the practical row limit well beyond what most business intelligence scenarios require for daily operational reporting.
Is DirectQuery or Import mode better for report performance?
Import mode delivers significantly faster report performance because data is compressed and stored in memory, allowing the VertiPaq engine to process queries without network latency or source database load constraints. DirectQuery sends every visual interaction as a live query to the source database, which introduces network round-trip delays and depends entirely on the source system’s query processing speed. If you need near real-time data freshness, consider using a composite model that combines imported aggregation tables with DirectQuery detail tables to balance performance against data currency requirements.
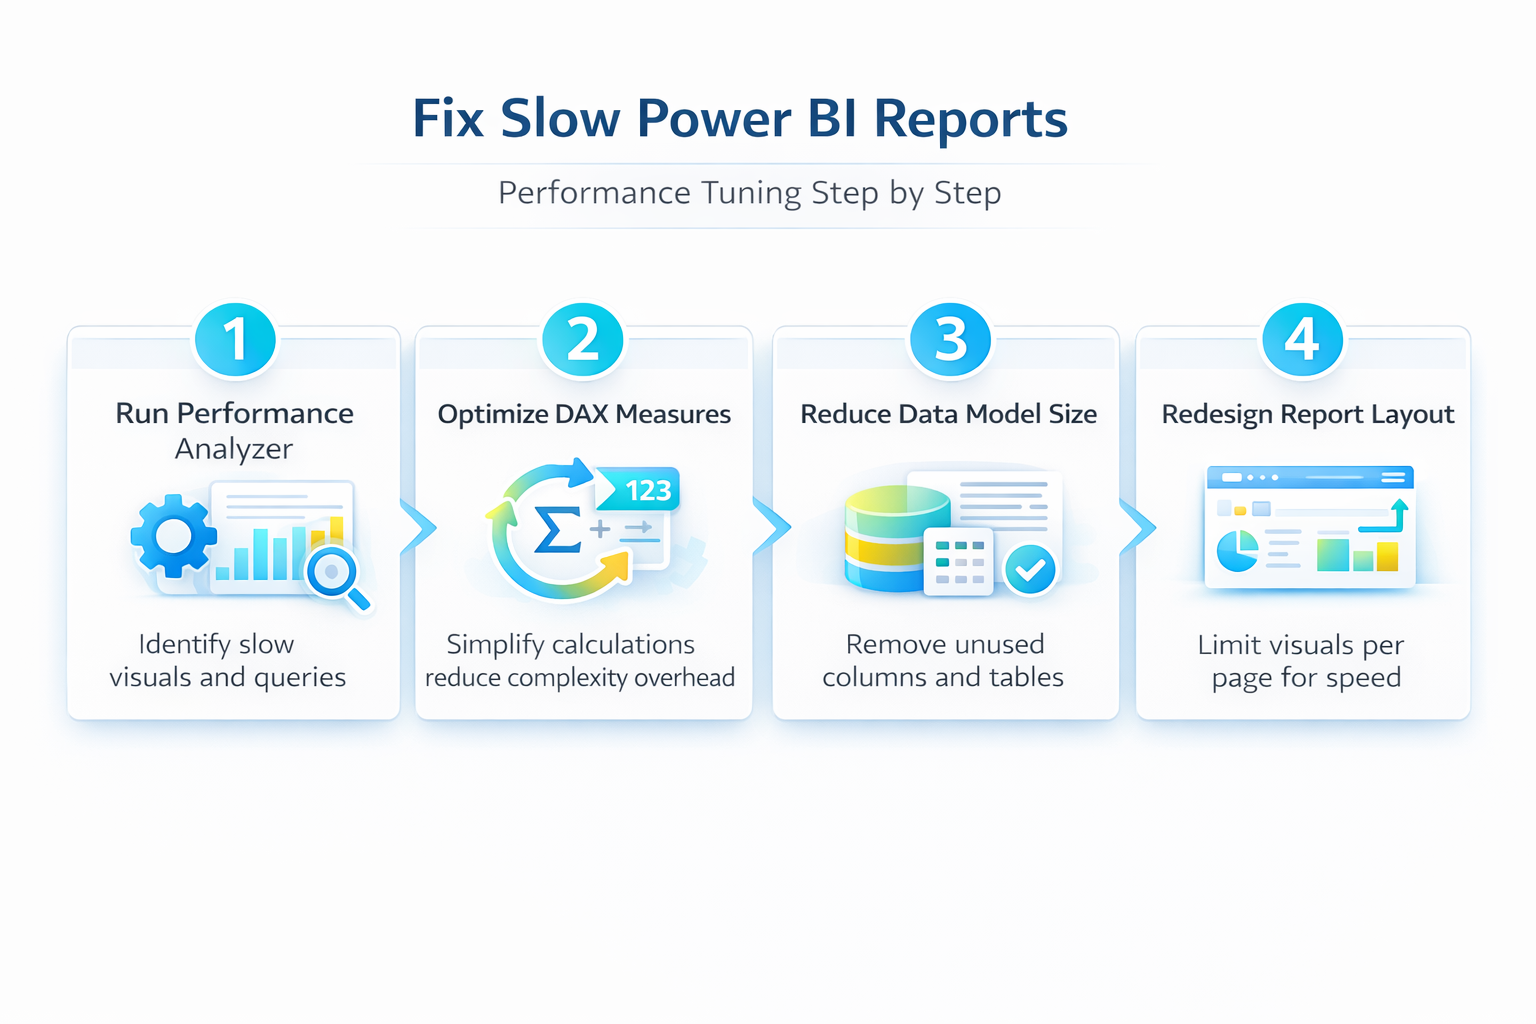
Optimizing a slow Power BI report requires attention to four key areas including query diagnostics, DAX efficiency, data model design, and visual layout choices that together determine the overall user experience. Applying the performance tuning steps described throughout this article should produce noticeable improvements in report load times and interactive responsiveness for your end users immediately.