Microsoft Copilot transforms the way professionals approach scenario planning inside Excel by automating complex what-if analysis tasks that previously required advanced formula knowledge and significant manual effort. Whether you need to forecast revenue changes, evaluate budget adjustments, or test pricing strategies, Copilot what-if analysis Excel capabilities let you build dynamic models using simple natural language prompts instead of writing complicated nested formulas from scratch.
This article walks you through the entire process of setting up, prompting, and refining what-if scenarios using Microsoft Copilot so you can make faster data-driven decisions with greater confidence.
Set up your Excel data
Before you ask Copilot to build any scenario model, you need a structured dataset formatted as an Excel table with clearly labeled column headers and consistent data types. Copilot reads your table structure to understand variable relationships, so ensuring clean data with no merged cells or blank rows helps the AI generate accurate and relevant what-if analysis results every time.
- Format as Excel table — Select your data range and press Ctrl+T to convert it into a structured table, which allows Copilot to recognize column headers, data boundaries, and relationships between variables automatically for scenario modeling purposes
- Label columns clearly — Use descriptive headers such as Revenue, Cost, Units Sold, and Profit Margin rather than abbreviations because Copilot interprets these labels to understand what each variable represents inside your spreadsheet analysis
- Remove blank rows and errors — Delete any empty rows, merged cells, or error values from your dataset before prompting Copilot because inconsistent data formatting prevents the AI assistant from generating accurate what-if scenario calculations and projections
Open Copilot in Excel
You can launch Copilot directly from the Excel ribbon by clicking the Copilot button located in the Home tab, which opens the AI assistant panel on the right side of your spreadsheet workspace. Make sure your Microsoft 365 subscription includes Copilot access and that your workbook is saved to OneDrive or SharePoint, since Copilot requires cloud-stored files to function properly within the Excel application environment.
Once the Copilot panel appears, you will see a text prompt area where you can type natural language requests about your data, including building what-if scenarios and sensitivity analysis models. The assistant analyzes your table structure and suggests relevant actions, though you can also write custom prompts that target specific variables, assumptions, and outcome calculations within your existing spreadsheet data.
Write effective what-if prompts
The quality of your Copilot scenario analysis Excel output depends heavily on how specifically you phrase your prompts, because vague requests produce generic results that rarely match your analytical needs. Structuring your prompt with a clear action verb, the target variable, the change percentage or value, and the desired output format gives Copilot enough context to produce useful what-if tables immediately.
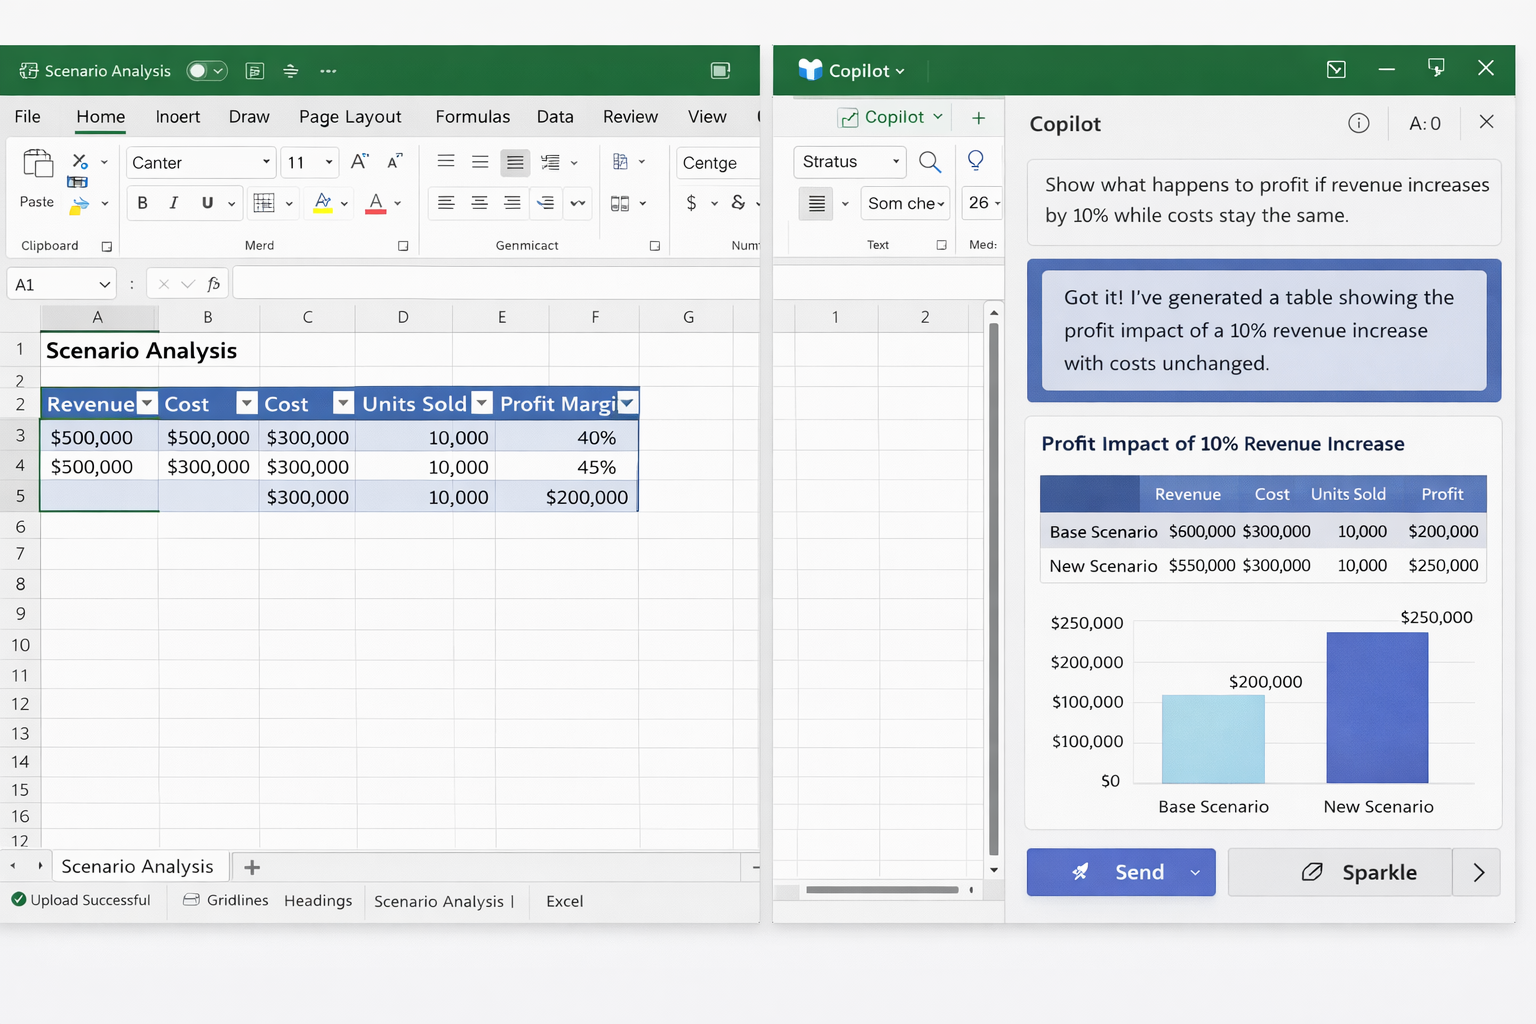
- Specify the variable and change — Write prompts such as “Show what happens to profit if revenue increases by ten percent and costs stay the same” to give Copilot a clear calculation target with defined parameters for the scenario
- Request multiple scenarios — Ask Copilot to “Create a table comparing profit at five percent, ten percent, and fifteen percent revenue growth” so you receive a side-by-side comparison of different assumptions rather than running each scenario individually and manually
- Include constraints and assumptions — Add context like “Assume fixed costs remain unchanged and variable costs increase proportionally with units sold” to help Copilot build more realistic models that reflect actual business conditions and constraints accurately
You can also generate Copilot charts in Excel to visualize your what-if results as dynamic graphs that update automatically when input assumptions change.

Build sensitivity analysis models
Sensitivity analysis helps you understand which variables have the largest impact on your outcomes, and Copilot can build these models by testing multiple input changes simultaneously across your entire dataset. Ask Copilot to “Create a sensitivity table showing how profit changes when both price and volume vary by five to twenty percent” to generate a matrix that reveals which combinations produce the best and worst financial results.
This approach works particularly well for identifying trends in Excel with Copilot because the AI can highlight patterns across hundreds of scenario combinations that would take hours to calculate manually using traditional spreadsheet formulas. Copilot presents sensitivity results in formatted tables with conditional formatting that makes it easy to spot optimal scenarios and risk thresholds at a quick glance.
Refine and iterate your scenarios
After Copilot generates your initial what-if analysis, you should review the output carefully and ask follow-up prompts to refine assumptions, add new variables, or adjust the range of values being tested. The conversational nature of Copilot means you can build increasingly complex scenario models by layering additional prompts on top of previous results without starting the entire analysis over from the beginning each time.
- Add new variables — Follow up with prompts like “Now also factor in a three percent inflation rate on material costs” to extend your existing what-if model with additional real-world assumptions that make projections more accurate and reliable
- Change output format — Request that Copilot “Convert this scenario table into a chart showing profit trends across all three scenarios” so you can present findings visually to stakeholders who prefer graphical summaries over raw numerical tables
- Save scenarios for comparison — Copy each scenario output to a separate worksheet tab and label it clearly so you can compare different assumption sets side by side when making final business decisions about pricing, staffing, or budget allocation
You can also build Copilot dashboards in Excel that combine multiple what-if scenarios into a single interactive view for executive presentations and team reviews.
Best practices for accurate results
Getting reliable what-if analysis results from Copilot requires following several data preparation and prompting practices that ensure the AI interprets your spreadsheet correctly and generates meaningful scenario projections every single time. These practices help you avoid common mistakes that lead to inaccurate calculations, misleading trend projections, and wasted time troubleshooting formula errors in your scenario models.
- Use realistic value ranges — Set scenario variables within plausible business ranges rather than testing extreme values, because Copilot produces more actionable insights when assumptions reflect genuine market conditions and historical performance data accurately
- Validate formulas manually — Spot-check at least two or three Copilot-generated calculations against your own manual math to confirm the AI applied the correct logic, especially when working with complex multi-variable scenarios and nested assumptions
- Keep prompts conversational — Write prompts in natural business language rather than technical Excel formula syntax, because Copilot understands context better when you describe what you want to analyze in plain terms that match your analytical objectives
If you work with large datasets, you may also want to learn how to open large CSV files in Excel before running Copilot analysis on imported data.
Frequently asked questions
How do I use Copilot to create a what-if analysis in Excel?
Open your Excel workbook with structured table data, click the Copilot button on the Home tab, and type a prompt describing the variables you want to test and the outcome you want to measure. Copilot generates a scenario table based on your specifications, and you can refine results with follow-up prompts that adjust assumptions, add new variables, or change the output format for presentation.
Can Microsoft Copilot build scenario models in Excel spreadsheets?
Yes, Copilot can build scenario models by analyzing your existing table data and generating what-if calculations based on natural language prompts that specify which variables to change and by how much. The AI produces formatted comparison tables showing multiple outcomes side by side, and you can iterate with additional prompts to layer more complex assumptions onto your models.
What prompts work best for Copilot what-if analysis in Excel?
The most effective prompts include a specific action verb, the target variable name, the exact percentage or value change, and the desired output format such as table or chart for clear results. For example, asking “Show how quarterly profit changes if sales increase by ten percent while costs rise by three percent” gives Copilot precise parameters to build an accurate and immediately useful what-if scenario.
Microsoft Copilot makes what-if analysis accessible to every Excel user regardless of their formula expertise, turning complex scenario planning into a conversational workflow powered by artificial intelligence. Start by formatting your data as a structured table, write specific prompts that define your variables and assumptions clearly, and iterate on results until your scenarios match the analytical depth your business decisions require. Try using Copilot in Teams for Excel collaboration to share your what-if models with colleagues and gather feedback in real time during planning sessions.