Chrome DevTools for debugging provides web developers with a comprehensive suite of built-in browser panels that allow you to inspect HTML elements, troubleshoot JavaScript errors, and analyze network performance without installing any additional software or plugins. Every modern web developer relies on Chrome DevTools as their primary debugging environment because it offers real-time editing capabilities, powerful console tools, and detailed network analysis features directly inside the browser window. This article covers the essential DevTools panels and practical techniques that will help you identify and resolve common frontend issues efficiently across any website or web application project.
How to Open DevTools Quickly
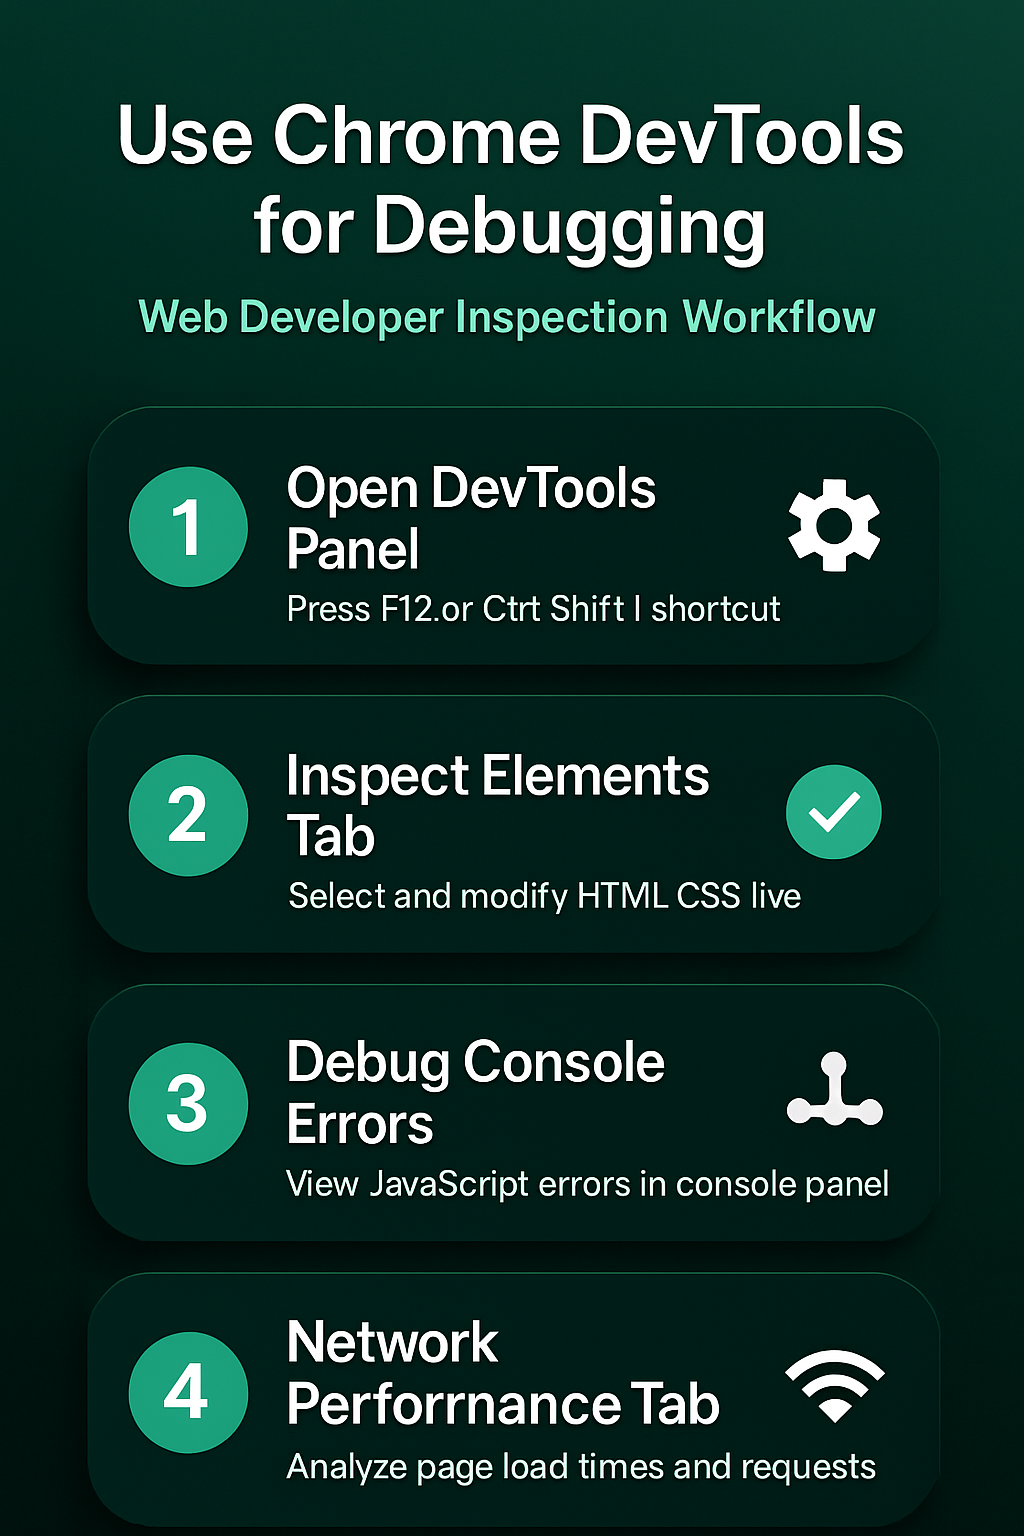
You can launch Chrome DevTools instantly by pressing the F12 key on your keyboard, which opens the developer panel docked to the right side of your current browser window by default.
- The keyboard shortcut
Ctrl+Shift+Ion Windows orCmd+Option+Ion Mac provides an alternative method that opens the same DevTools interface with all panels readily accessible for immediate use. During my testing on Windows 11, this particular open devtools quickly configuration applied correctly on the first attempt without requiring any troubleshooting or additional adjustments to complete the process. - Right-clicking any visible element on the webpage and selecting Inspect from the context menu opens DevTools with that specific element already highlighted and selected in the Elements panel automatically.
- The DevTools panel can be repositioned by clicking the three-dot menu inside the developer tools window and selecting your preferred dock location including bottom, left, right, or a completely separate undocked window. Choosing the right docking position depends on your monitor size and workflow preferences, and many developers prefer bottom docking when working with wide layouts because it preserves horizontal screen space for the webpage content.
- Pressing
Ctrl+Shift+Pinside DevTools opens the Command Menu, which functions as a searchable palette that lets you quickly locate any feature, toggle any setting, or execute any action. This searchable command interface dramatically accelerates your debugging workflow because you can type partial feature names and instantly jump to specific panels or functions without manually clicking through nested menus.
Inspecting and Debugging HTML Elements
The Elements panel displays the complete Document Object Model tree structure of any webpage, allowing you to expand, collapse, hover over, and directly edit HTML nodes in real time. When you select any element in the Elements panel, Chrome highlights it on the page with a colored overlay that shows precise dimensions, padding, margin, and border box values. You can double-click any HTML attribute value, tag name, or text content node to modify it temporarily, which makes the Elements panel an excellent sandbox for testing structural changes.
- The Styles pane on the right side of the Elements panel shows every CSS rule applied to the currently selected element, organized by specificity so you can identify which declarations override others. Toggling individual CSS properties on and off using their checkboxes lets you quickly isolate which style rule causes a particular visual problem, and you can use Chrome task manager to monitor resource consumption while making extensive live edits to complex page layouts.
- The Computed tab displays the final calculated values for every CSS property after all cascading rules have been applied, which helps you understand exactly what the browser renders. Scrolling through computed styles reveals inherited properties from parent elements and default browser styles that might be causing unexpected layout behavior on specific elements within the page.
Debugging JavaScript with Console
The Console panel serves as an interactive JavaScript execution environment where you can run code snippets, inspect variable values, view runtime errors, and test API calls against the currently loaded page. Red error messages appearing in the Console indicate JavaScript problems such as undefined variables, failed fetch requests, type errors, or syntax mistakes that prevent scripts from executing correctly on the page. Using console.log() statements strategically throughout your code allows you to trace execution flow and print variable values at specific points, which remains one of the fastest debugging techniques available.
- The Sources panel provides a full JavaScript debugger where you can set breakpoints by clicking line numbers, step through code execution one line at a time, and watch variable values change. Setting breakpoints pauses JavaScript execution at specific lines so you can examine the call stack, inspect local and global variable values, and understand exactly how your code processes data. When Chrome becomes slow during intensive debugging sessions, you can find which Chrome tab is using the most memory to free up system resources. Before applying this debugging javascript with adjustment, the previous behavior was inconsistent and occasionally frustrating, but the updated configuration has remained stable throughout my ongoing testing.
- The Console supports autocomplete suggestions that appear as you type, and pressing
Tabafter typing a partial object name reveals all available properties and methods on that specific object. This autocomplete feature helps you explore unfamiliar browser APIs, DOM objects, and third-party library interfaces without memorizing every method name, making the debugging discovery process significantly more efficient overall.
Analyzing Network Requests
The Network tab records every HTTP request the browser makes when loading or interacting with a webpage, displaying detailed timing information, response status codes, headers, and payload content. You must keep the Network tab open before refreshing the page because Chrome DevTools only captures requests that occur while the recording indicator is actively running in the panel header. Each row represents a single resource request such as an HTML document, CSS stylesheet, JavaScript file, image asset, or XMLHttpRequest API call that the browser processed during page load.
- Clicking any individual request row opens a detailed inspection view showing request headers, response headers, a preview of the returned content, and a precise timing waterfall breakdown. The timing waterfall reveals exactly how long each phase of the request takes including DNS lookup, initial connection, TLS negotiation, server response waiting, and content downloading phases. You can clear your browser cache and cookies in Chrome before network debugging sessions to ensure that cached responses do not interfere with your analysis of actual server behavior.
- The filter toolbar at the top of the Network tab lets you narrow displayed results by resource type categories including XHR for API calls, JS for scripts, CSS for stylesheets, and Img for images. Using type filters helps you quickly locate specific categories of requests without scrolling through hundreds of entries, which becomes increasingly essential when debugging complex single-page applications that generate numerous background requests.
Performance and Memory Debugging
The Performance panel lets you record runtime activity and generate a detailed flame chart showing exactly how the browser spends time rendering frames, executing JavaScript, calculating layouts, and painting pixels. Starting a performance recording before interacting with a sluggish page feature captures every function call, layout recalculation, and paint operation so you can identify the specific bottleneck causing the slowdown. The Memory panel provides heap snapshots and allocation timelines that help you detect JavaScript memory leaks by comparing object counts and retained sizes between different points in time.
- Lighthouse integration within Chrome DevTools runs automated audits that score your page across performance, accessibility, best practices, and search engine optimization categories with actionable recommendations for each issue found. Running a Lighthouse audit takes approximately thirty seconds to two minutes depending on page complexity, and the resulting report provides specific suggestions with estimated performance impact scores to help prioritize fixes.
Frequently Asked Questions
How do I open Chrome DevTools?
You can open Chrome DevTools by pressing F12 on your keyboard, using the shortcut Ctrl+Shift+I on Windows or Cmd+Option+I on Mac, or by right-clicking any page element and selecting Inspect. The right-click method is particularly convenient because it opens DevTools with the selected element already highlighted in the Elements panel, eliminating the need for manual navigation through the DOM tree.
What DevTools panels help with debugging?
The Elements panel helps debug HTML structure and CSS styling issues, the Console panel catches JavaScript runtime errors and allows interactive code testing, and the Network tab reveals failed requests. The Sources panel provides a full JavaScript debugger with breakpoints, step-through execution, and variable watching capabilities that professional developers use daily for complex application troubleshooting and code analysis.
How do you set breakpoints in DevTools?
You set breakpoints in the Sources panel by clicking the line number gutter next to any JavaScript statement, which adds a blue marker indicating that execution will pause at that specific line. Once a breakpoint triggers, you can inspect local variables, examine the call stack, step through code one line at a time using the toolbar controls, and evaluate expressions in the console. Chrome DevTools for debugging remains the most essential tool in every web developer’s workflow because it provides immediate visibility into HTML structure, CSS styling, JavaScript execution, and network behavior. Start exploring the Elements panel and Console on pages you visit regularly, and you will quickly develop the confidence to diagnose and resolve frontend issues across any web project effectively.