
In this tutorial on data visualization we will show how to easily plot line charts using the pandas library which yo might already be using for your data analysis work.
We’ll start by defining a simple example DataFrame that you can use to follow along.
import pandas as pd

dates = pd.Series(pd.date_range(start='3/1/23', end = '3/14/23', freq='B'))
interviews = [37, 33, 31, 34, 39, 35, 36, 32, 30, 38]
hired = [16, 12, 18, 19, 10, 11, 15, 13, 14, 17]

revenue = pd.DataFrame(dict(interviews=interviews, hired=hired), index = dates)
Pandas line plot example
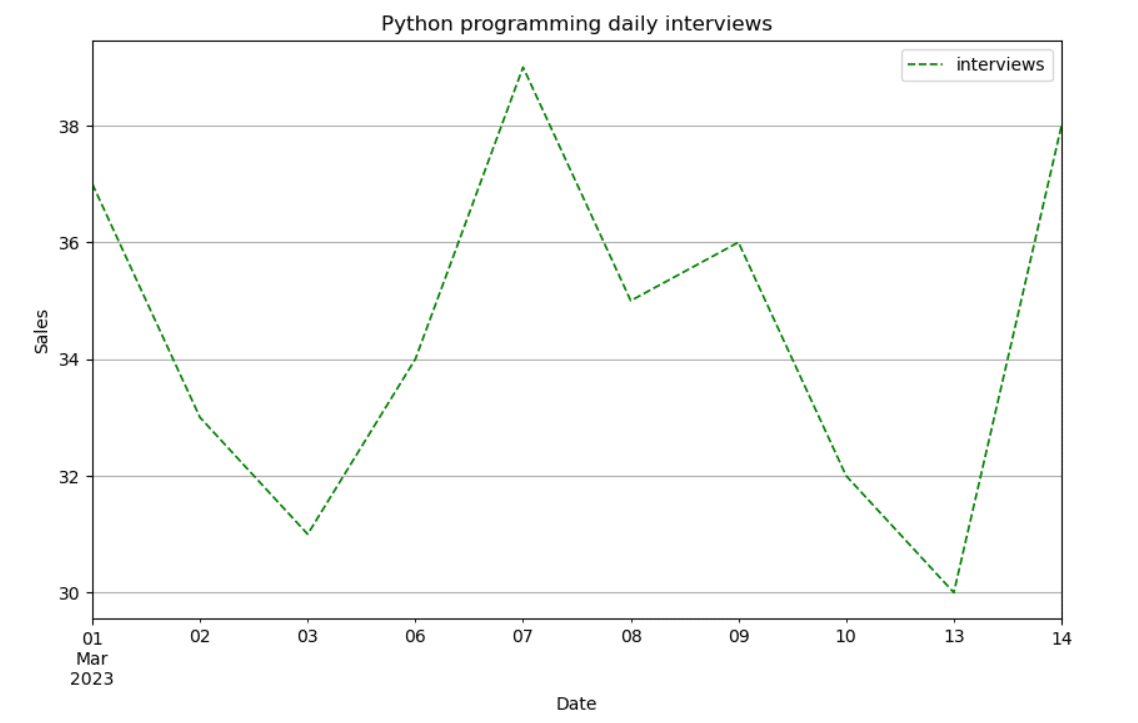
Let’s start by drawing a simple graph. We will use the DataFrame plot() method:
# define the line properties
kwargs = dict (linestyle='dashed', color='green', linewidth=1.2)
# x axes will by default show the df index
line_plot = revenue.plot( y = 'interviews', figsize= (10,6),**kwargs )
line_plot.set_title('Python programming daily interviews')
line_plot.grid()
line_plot.set_xlabel('Date')
line_plot.set_ylabel('Sales');
Here we go:
Line plot for multiple columns and lines with pandas
Most probably you’ll need to draw graphs that represents multiple columns. The trick is to pass a list of column names to the y parameter (marked in bold).
# multiple columns line plot

kwargs= dict (linestyle='dashed', color=['red', 'green'], linewidth=1.2)
line_plot = revenue.plot( y = ['interviews', 'hired'], figsize= (10,6),**kwargs )
line_plot.set_title('Python programming daily interviews vs hires')
line_plot.grid()
line_plot.set_xlabel('Date')
line_plot.set_ylabel('Sales');
Here’s the chart:

Line plots with markers
If we would like to draw marker on our line, we will need to modify the line parameters. We will use the marker parameter and pass the value ‘x’, ‘o’ or any additional marker style.
kwargs= dict (linestyle='dashed', color=['red', 'green'], linewidth=1.2, marker='x')Groupby and line plot with pandas
In this section we would like to group our interview data by week using the DateTime index and then plot the result.
rev_week = revenue.groupby(revenue.index.isocalendar().week).agg(number_of_interviews= ('interviews', 'sum'))
rev_week_plot = rev_week.plot()
rev_week_plot.set_xticks([9,10,11]);
Here we go:

Follow up learning: