
In today’s tutorial we’ll learn how to quickly create and customize crosstabs. As part of our Data Analysis work in Pandas, we typically use crosstabs in order to count , plot and analyze frequencies of occurrences on multiple columns.
Importing our data
For this example we’ll import a simple csv file that is located in the same working directory as our Pythin notebook or script:
# import pandas
import pandas as pd

sal_df = pd.read_csv('hr.csv')

print(sal_df)
Here’s our data:
Create a Simple Pandas crosstab
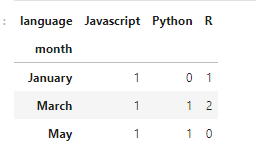
We’ll call the pd.crosstab function and render a very simple crosstab:
crosstb1 = pd.crosstab(index = sal_df['month'], columns = sal_df['language'])

crosstb1
Note that by default the crosstab displays the occurrence count (not the unique / distinct values) and there is no need to specify the aggfunc = count parameter.
Create a cross tab with percentages
By definition, the crosstab counts the occurrences of each row in the DataFrame. We can do the same using a Pandas Pivot Table. What’s special about the crosstab function, if that as we mentioned before, it also allows to easily computer the relative frequency between values in different columns. We do that by adding the normalize=True parameter.
crosstb2 = pd.crosstab(index = sal_df['month'],  \
                      columns = sal_df['language'] , \
                      normalize=True) *100
crosstb2
Using a simple snippet we computed the relative frequency (percentage) of each observation in our data.

Adding a total column and row to the crosstab
Next, we’ll use the margins and margins_name parameters to add a summary column and row to the table.
crosstb3 = pd.crosstab(index = sal_df['month'],  \
                      columns = sal_df['language'] , \
                      normalize=True, margins = True, \
                      margins_name= "Total") *100
crosstb3
To improve the look and feel of our table, we’ll append percentage signs to each cell in the cross tab. In order to do so, we’ll first convert the crosstab contents to a Python string data type. We do that by using the astype DataFrame method. We then append the % character using a simple lambda function.
crosstb3.astype(str).apply(lambda x:x + '%')Here is the resulting crosstab:

Pandas crosstabs with multiple columns
Next, we would like to allow an easier drill down into the data by adding another level to our crosstab columns section. Note that instead of passing a single column we are passing a list containing the columns we want displayed.
crosstb4 = pd.crosstab(index = sal_df['month'],  \
                      columns = [sal_df['language'], sal_df['office']] , \
                      normalize=True, margins = True, \
                      margins_name= "Total") *100

crosstb4.astype(str).applymap(lambda x:x + '%')